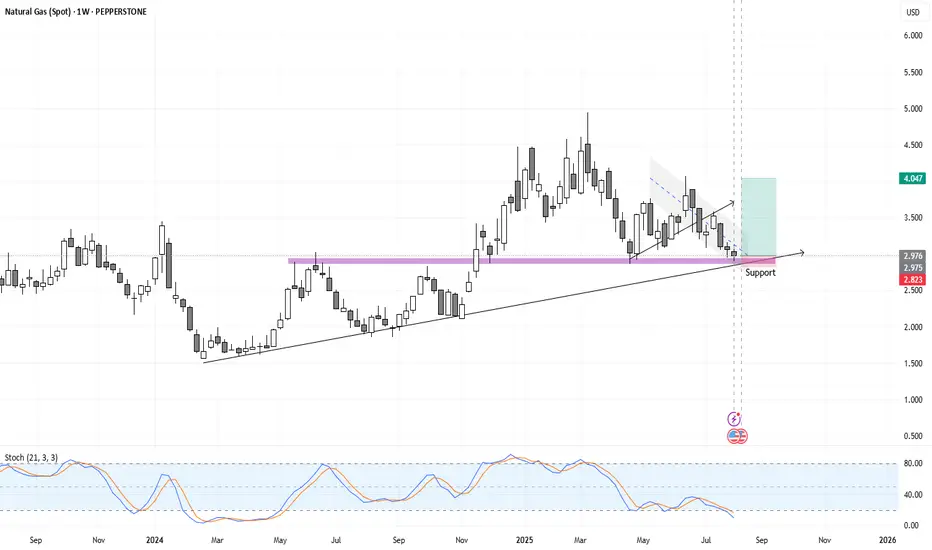
This weekly chart of Natural Gas (Spot) shows the price currently trading around 2.976 USD, sitting directly on a long-term ascending trendline and a horizontal support zone near 2.82–2.85 USD. The support has been tested multiple times in the past, reinforcing its importance as a key demand area. The stochastic oscillator at the bottom is deep in the oversold region, hinting at potential reversal conditions.
The recent candles show a downtrend channel that has just been broken to the upside, suggesting the possibility of a trend change. A highlighted green box indicates the potential upside target area around 4.04 USD if the rebound from support continues. This aligns with a technical bounce expectation after prolonged downside pressure.
Overall, the chart implies a bullish short-to-medium-term outlook if the support holds. A break below the ascending trendline would invalidate this scenario and could trigger deeper declines. However, with strong confluence of trendline, horizontal support, and oversold momentum, the probability of an upward move appears favorable.
Disclaimer
The information and publications are not meant to be, and do not constitute, financial, investment, trading, or other types of advice or recommendations supplied or endorsed by TradingView. Read more in the Terms of Use.
Disclaimer
The information and publications are not meant to be, and do not constitute, financial, investment, trading, or other types of advice or recommendations supplied or endorsed by TradingView. Read more in the Terms of Use.