Midterm forecast:
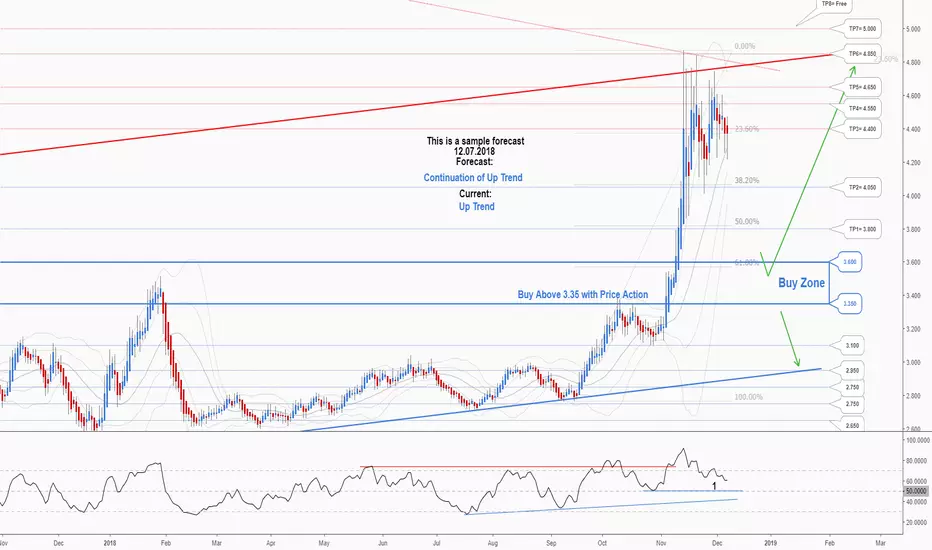
The current trend is uptrend and the forecast is continuation of uptrend.
Technical analysis:
While the RSI support #1 at 52 is not broken, the probability of price decrease would be too low.
A peak is formed in daily chart at 4.755 on 11/30/2018, so more losses to support(s) 4.400, 4.050, 3.800 and minimum to Trend Hunter Buy Zone (3.600 to 3.350) is expected.
Price is above WEMA21, if price drops more, this line can act as dynamic support against more losses.
Relative strength index (RSI) is 60.
Trading suggestion:
There is possibility of temporary retracement to suggested Buy Zone (3.600 to 3.350). We wait during the retracement, until the price tests the zone, whether approaching, touching or entering the zone.
Beginning of entry zone (3.600)
Ending of entry zone (3.350)
Entry signal:
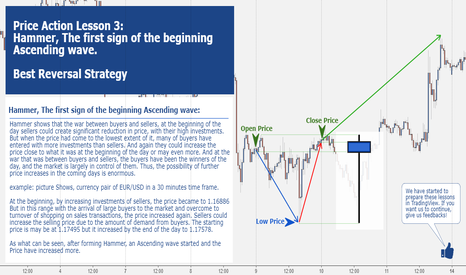
Signal to enter the market occurs when the price comes to "Buy zone" then forms one of the reversal patterns, whether "Bullish Engulfing", "Hammer" or "Valley" in other words, NO entry signal when the price comes to the zone BUT after any of reversal patterns is formed in the zone. To learn more about "Entry signal" and the special version of our "Price Action" strategy FOLLOW our lessons:
Take Profit:
TP1= @ 3.800
TP2= @ 4.050
TP3= @ 4.400
TP4= @ 4.550
TP5= @ 4.650
TP6= @ 4.850
TP7= @ 5.000
TP8= Free
The current trend is uptrend and the forecast is continuation of uptrend.
Technical analysis:
While the RSI support #1 at 52 is not broken, the probability of price decrease would be too low.
A peak is formed in daily chart at 4.755 on 11/30/2018, so more losses to support(s) 4.400, 4.050, 3.800 and minimum to Trend Hunter Buy Zone (3.600 to 3.350) is expected.
Price is above WEMA21, if price drops more, this line can act as dynamic support against more losses.
Relative strength index (RSI) is 60.
Trading suggestion:
There is possibility of temporary retracement to suggested Buy Zone (3.600 to 3.350). We wait during the retracement, until the price tests the zone, whether approaching, touching or entering the zone.
Beginning of entry zone (3.600)
Ending of entry zone (3.350)
Entry signal:
Signal to enter the market occurs when the price comes to "Buy zone" then forms one of the reversal patterns, whether "Bullish Engulfing", "Hammer" or "Valley" in other words, NO entry signal when the price comes to the zone BUT after any of reversal patterns is formed in the zone. To learn more about "Entry signal" and the special version of our "Price Action" strategy FOLLOW our lessons:
Take Profit:
TP1= @ 3.800
TP2= @ 4.050
TP3= @ 4.400
TP4= @ 4.550
TP5= @ 4.650
TP6= @ 4.850
TP7= @ 5.000
TP8= Free
High Accurate forecasts by 4CastMachine AI
✅36 Forex Pairs
✅175 Cryptos
✅16 Indices
✅Gold, Silver...
👉Follow.ForecastCity.com
FREE Telegrams:
👉t.me/ForecastCity_com
👉t.me/Free_Forex_AI
👉t.me/Free_Crypto_AI
✅36 Forex Pairs
✅175 Cryptos
✅16 Indices
✅Gold, Silver...
👉Follow.ForecastCity.com
FREE Telegrams:
👉t.me/ForecastCity_com
👉t.me/Free_Forex_AI
👉t.me/Free_Crypto_AI
Disclaimer
The information and publications are not meant to be, and do not constitute, financial, investment, trading, or other types of advice or recommendations supplied or endorsed by TradingView. Read more in the Terms of Use.