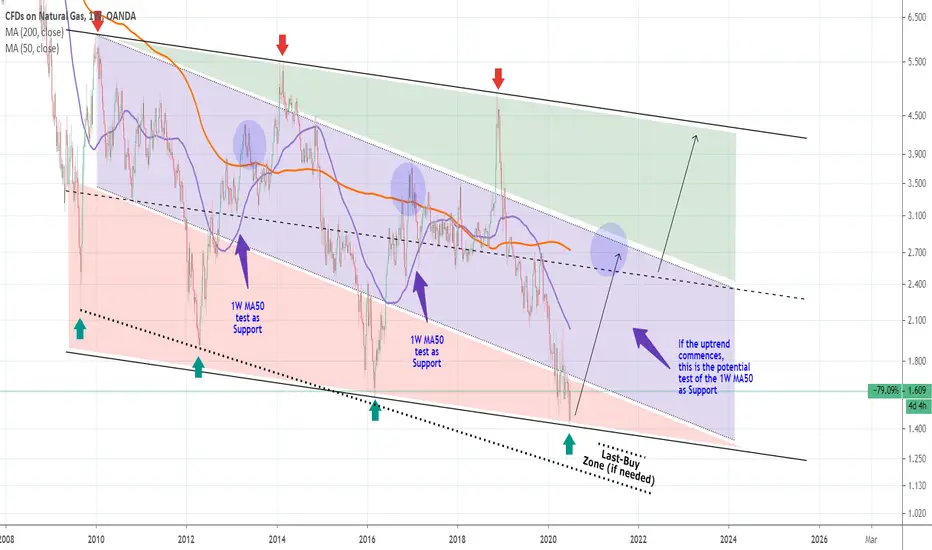
Natural Gas is trading within a Channel Down (on the log scale) on the 1W chart (RSI = 45.584, MACD = -0.111, ADX = 31.401) since 2009. This pattern provides very accurate Cycles, bullish when a Lower Low is made (green arrows) and bearish when a Lower High is made (red arrows).
At the moment the price has just made contact with the Lower Low trend-line, making Natural Gas an automatic long-term buy opportunity for the next 2-3 years. Keep a few reserves for the lower slope dotted Lower Low trend-line for one last buy if needed. Depending on your risk tolerance book the profit just above the 1W MA200 (orange trend-line) and re-buy on the test of the 1W MA50 as support. This pattern took place on the previous two Cycles.
** If you like our free content follow our profile to get more daily ideas. **
Comments and likes are greatly appreciated.
Telegram: t.me/investingscope
investingscope.com
Over 65% accuracy on Private Signals Channel.
Over 15% return monthly on our Account Management Plan.
Account RECOVERY services.
Free Channel: t.me/investingscopeofficial
investingscope.com
Over 65% accuracy on Private Signals Channel.
Over 15% return monthly on our Account Management Plan.
Account RECOVERY services.
Free Channel: t.me/investingscopeofficial
Disclaimer
The information and publications are not meant to be, and do not constitute, financial, investment, trading, or other types of advice or recommendations supplied or endorsed by TradingView. Read more in the Terms of Use.