This analysis was prepared by Dr. Igor Isaev in cooperation with Anastasia Volkova, LSE analyst.
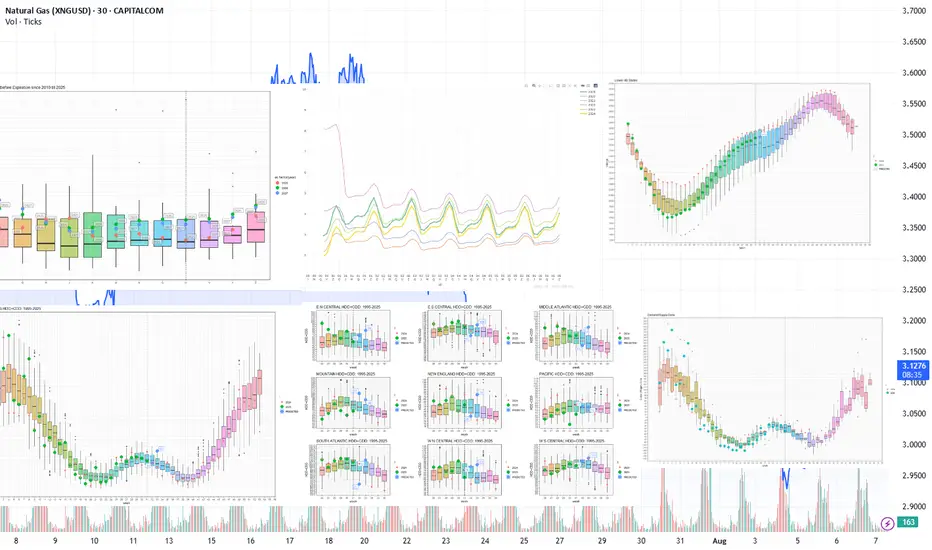
Current prices vs. price spread 10 days before expiration by month since 2010
(The top left graph)
Contract U is trading at the same level as the average price 10 days before expiration for all expired contracts over the previous 15 years. The futures prices of the Fall 2025 contracts are trading even closer to the median values on the expiration date, while remaining within the interquartile range. Prices of the 2026 and 2027 Winter contracts are declining but have not yet broken through the upper quartile values.
Current forward curve vs. 2020-2024
(The top graph in the middle)
Although the 3-year delivery contract prices as of 2025 have approached the levels of similar 2023 and 2024 contracts, a pronounced forward curve skew remains in the near-term (1-2 years) and distant (5-6 years) delivery segments.
Current inventory and forecast for next week compared to 2019-2024
(The top right graph)
For week 31 (July 28 —August 03), we expect a +16 BCF gain in storage. The fill rate is confidently holding above the median for the preceding 5 years. Injection rates maintain positive dynamics. If the current supply and demand balance stabilizes, reaching levels similar to 2024 peak values is possible. The weather and seasonal phenomena of late summer — early fall remain a restraining factor.
Weekly HDD+CDD total from current NOAA data and forecast for the next two weeks comparing 1994-2024
(The lower left graph)
In the current, 32nd week, the weather is holding steady, reflecting the average values from observations over the past 30 years. Although the seasonal peak HDD+CDD has almost passed, next week (33) is forecast to have significantly above average HDD+CDD values.
Explanation of the chart: candles represent quantiles for 30 years from 1994 to 2024. Red dots 2024, green 2025, blue prediction 2025.
Weekly HDD+CDD total from current NOAA data and forecast for the next two weeks compared to 1994-2024 by region
(The lower graph in the middle)
Looking by region, we see elevated HDD+CDD at week 33 in almost all regions.
Weekly cumulative supply/demand differentials compared to 2014-2024
(The lower right graph)
In the current 32nd week, the supply-demand differential has fallen below the median, almost to the edge of the lower interquartile range. On the demand side, we see a strong decline in consumption by power generation and a recovery in LNG exports. On the supply side, production continues to grow, but imports from Canada have dropped.
Head of Analytics Center at the European broker Mind-Money.eu
👉 mind-money.eu
Website
👉 igorisaev.com/
👉 mind-money.eu
Website
👉 igorisaev.com/
Disclaimer
The information and publications are not meant to be, and do not constitute, financial, investment, trading, or other types of advice or recommendations supplied or endorsed by TradingView. Read more in the Terms of Use.