Ultimately I am bullish on Natural Gas in higher time frame and so this is quite an aggressive short trade.
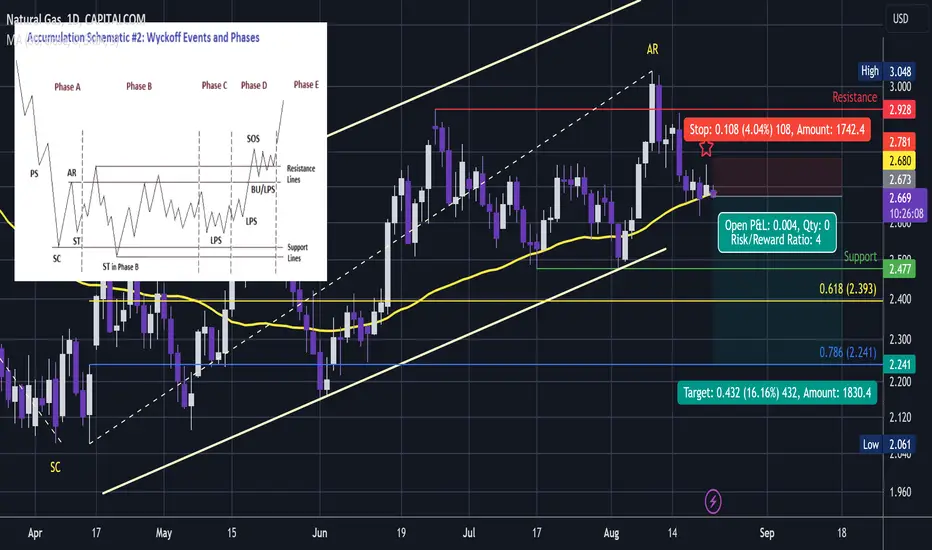
But that said it appears quite obviously to have completed AR Automatic Rally as a bearish ascending channel with overlapping highs revealing upside weakness.
This next wave down would complete ST Secondary Test. There is high liquidity below the low @ $2.061 and that will attract price. There is a reasonable that it will print a lower low to tap the liquidity and print ST.
And so a big shakeout dump is probably coming.
Currently it is pressing down on the 50 day MA and will likely fall through soon.
There is a little upper wicked shooting star candle and the selling pressure in that area gives us a clue that upward momentum has been halted and we're close to the next move down.
The star candle allows quite a tight stop loss just above and so margin can be increased for this trade.
3 targets for this trade:
1st target is the 0.618 retracement: 2.393. This is a 2.6:1 RR trade.
2nd target is the 0.786 retracement: 2.241. This is a 4:1 RR trade
3rd target is the low: $2.061. This is a 5.6:1 RR trade.
SL: 2.781
TP1: 2.393
TP2: 2.241
TP3: 2.061
Not advice
Note
It hasn't fallen away and there has been a small pop in a shallow area that shows potential for a bounce.Also bullish RSI coming in.
If you really liked the short then you could build a position here, but since this is aggressive I will exit and only re-enter my short if there is a bounce.
Note
Here comes that bounce back up through the lower channel trendline. We'll be looking to see if there is another short entry but only after weak price action. Note
NATURALGASUntil there is some obvious bearish price action then its not obvious what happens next.
It has fallen through the 50 day MA, the lower channel trendline and has now seen a small pop from the 100MA, but as yet not obvious bearish price action, it is still quite shallow to the downside.
If it starts to hug the 100MA then that could be a clue it will roll over, of if not then perhaps another bounce is coming.
Also as we looked at before, if it pattern separates to print a shallow ascending channel then that would be a clue and an opportunity to short.
Having made several overlapping tops but no significant upward discovery is a red flag.
Also if you consider that the market wants to explore liquidity then that is below the low ready to get rumbled 🤨.
Note
There's that bounce we were looking for with a big gap up to start the week. We'll be looking to see if we get bearish corrective price action to show that lower lows are on the way.
Until we see that or some hugging of moving averages then this could still go higher.
Price action overall looks ugly and ascending so if it does make a new high then there is more chance it will be another shakeout and perhaps an opportunity to short.
We covered this in detail in the previous video.
Anyhow looking for lower lows and if patience pays off it will be a bullish trade with HUGE upside potential.
Note
This gap up and momentum candle down is a pattern we have seen a lot recently in RKLB & BIG; and I have covered it extensively in the weekend video.It is bearish. When you see a pattern like this you get out of the way if you are long. I have opened a small short yesterday and just added more now.
Also notice that again it is breaking through the 50MA and close to the channel low. If it pushes down lower then it may roll off the table down and down
As the image shows TradingView publishers and "indicators" are bullish here.
But this will be heading lower.
Once the lows arrive I will give entries to my clients then later follow up entries here on TradingVIew.
GL.
Note
The trend incline is shallowing and this is showing weakness. This will roll over and then we will be looking to get long DEEP value
Note
I will move the commentary on to a new thread,Your FA guru can't read a chart💭
I run a technical group with lots of content every day + regular videos, 1:1, chatroom 🚀.
Better than all the rest? My record speaks for itself 💡.
Telegram Group: $50 per month✨.
Contact: t.me/dRends35
I run a technical group with lots of content every day + regular videos, 1:1, chatroom 🚀.
Better than all the rest? My record speaks for itself 💡.
Telegram Group: $50 per month✨.
Contact: t.me/dRends35
Disclaimer
The information and publications are not meant to be, and do not constitute, financial, investment, trading, or other types of advice or recommendations supplied or endorsed by TradingView. Read more in the Terms of Use.
Your FA guru can't read a chart💭
I run a technical group with lots of content every day + regular videos, 1:1, chatroom 🚀.
Better than all the rest? My record speaks for itself 💡.
Telegram Group: $50 per month✨.
Contact: t.me/dRends35
I run a technical group with lots of content every day + regular videos, 1:1, chatroom 🚀.
Better than all the rest? My record speaks for itself 💡.
Telegram Group: $50 per month✨.
Contact: t.me/dRends35
Disclaimer
The information and publications are not meant to be, and do not constitute, financial, investment, trading, or other types of advice or recommendations supplied or endorsed by TradingView. Read more in the Terms of Use.