Natural Gas (NG1!) – Bearish Triangle Breakdown Setup
Chart Overview:
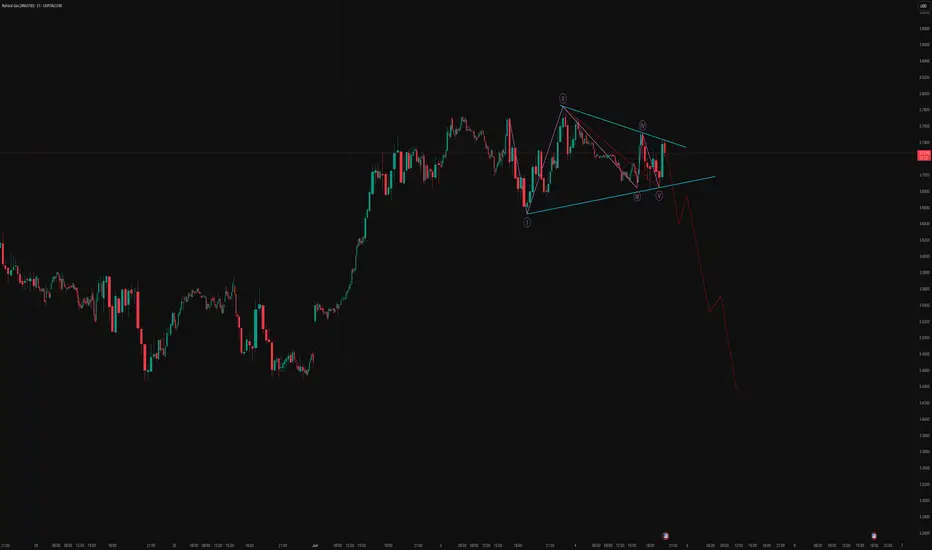
The chart clearly forms a Symmetrical Triangle, typically a continuation pattern.
The structure is labeled with classic Elliott Wave counts (1 to 5), suggesting the end of a contracting triangle phase.
A sharp, impulsive red arrow path is projected downward, indicating a possible strong bearish move post-breakout.
Technical Interpretation:
Symmetrical Triangle Formation:
Price is consolidating with lower highs and higher lows.
The triangle’s apex is near, signaling an imminent breakout.
Elliott Wave Count:
A perfect 5-wave subdivision (1-2-3-4-5) inside the triangle.
Wave ‘V’ just completed, suggesting the end of consolidation.
Breakdown Expected:
A breakdown below the lower trendline would confirm the end of the corrective structure.
Post-breakdown, we can expect a sharp and impulsive fall in price, matching the projected red path.
Targets:
Immediate Target: Breakdown objective is typically the widest part of the triangle projected downward.
While the exact price targets are not labeled, based on the structure:
First Target Zone: ~$3.50 levels.
Extended Target Zone: ~$3.30 to $3.40 levels.
Key Observations:
Volume Confirmation Needed: Ideally, volume should spike on breakdown to confirm the move.
Bearish Bias: Failure to break above the triangle resistance and a decisive close below support shifts the bias strongly bearish.
Market Context: Seasonal factors, storage data, and weather forecasts often affect Natural Gas volatility—watch for fundamental confirmations.
Risk Factors:
False Breakouts: Be cautious of fake moves — confirmation is critical.
Triangle Failure: If price reclaims the upper trendline (~3.74+), bearish setup gets invalidated.
External News: Geopolitical, weather-related news can quickly impact Natural Gas prices.
Summary:
Pattern: Symmetrical Triangle
Wave Structure: 5-wave consolidation complete
Bias: Bearish breakdown expected
Immediate Downside Target: ~$3.50
Extended Target: ~$3.30–$3.40
Invalidation: Break above upper trendline (~3.74+)
Disclaimer:
This analysis is for educational purposes only and does not constitute trading advice. Natural Gas trading is highly volatile and subject to sudden price swings. Consult your financial advisor before taking any trading decisions.
Chart Overview:
The chart clearly forms a Symmetrical Triangle, typically a continuation pattern.
The structure is labeled with classic Elliott Wave counts (1 to 5), suggesting the end of a contracting triangle phase.
A sharp, impulsive red arrow path is projected downward, indicating a possible strong bearish move post-breakout.
Technical Interpretation:
Symmetrical Triangle Formation:
Price is consolidating with lower highs and higher lows.
The triangle’s apex is near, signaling an imminent breakout.
Elliott Wave Count:
A perfect 5-wave subdivision (1-2-3-4-5) inside the triangle.
Wave ‘V’ just completed, suggesting the end of consolidation.
Breakdown Expected:
A breakdown below the lower trendline would confirm the end of the corrective structure.
Post-breakdown, we can expect a sharp and impulsive fall in price, matching the projected red path.
Targets:
Immediate Target: Breakdown objective is typically the widest part of the triangle projected downward.
While the exact price targets are not labeled, based on the structure:
First Target Zone: ~$3.50 levels.
Extended Target Zone: ~$3.30 to $3.40 levels.
Key Observations:
Volume Confirmation Needed: Ideally, volume should spike on breakdown to confirm the move.
Bearish Bias: Failure to break above the triangle resistance and a decisive close below support shifts the bias strongly bearish.
Market Context: Seasonal factors, storage data, and weather forecasts often affect Natural Gas volatility—watch for fundamental confirmations.
Risk Factors:
False Breakouts: Be cautious of fake moves — confirmation is critical.
Triangle Failure: If price reclaims the upper trendline (~3.74+), bearish setup gets invalidated.
External News: Geopolitical, weather-related news can quickly impact Natural Gas prices.
Summary:
Pattern: Symmetrical Triangle
Wave Structure: 5-wave consolidation complete
Bias: Bearish breakdown expected
Immediate Downside Target: ~$3.50
Extended Target: ~$3.30–$3.40
Invalidation: Break above upper trendline (~3.74+)
Disclaimer:
This analysis is for educational purposes only and does not constitute trading advice. Natural Gas trading is highly volatile and subject to sudden price swings. Consult your financial advisor before taking any trading decisions.
Disclaimer
The information and publications are not meant to be, and do not constitute, financial, investment, trading, or other types of advice or recommendations supplied or endorsed by TradingView. Read more in the Terms of Use.
Disclaimer
The information and publications are not meant to be, and do not constitute, financial, investment, trading, or other types of advice or recommendations supplied or endorsed by TradingView. Read more in the Terms of Use.