📈 Natural Gas (NG1!) Analysis – Triangle Breakout Imminent
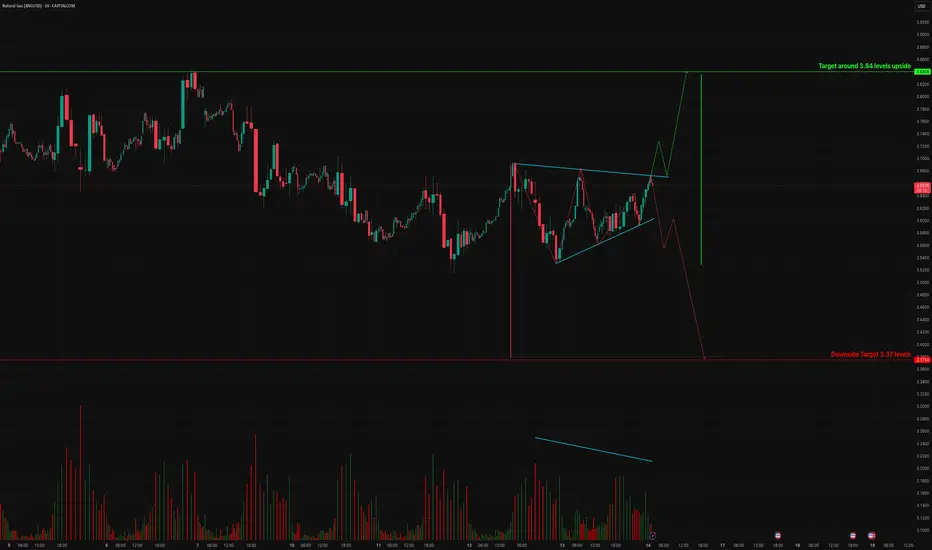
The Natural Gas 30-minute chart has formed a contracting triangle over the past several sessions, with volatility compressing into a tighter range. This pattern typically signals an impulsive move once the breakout occurs.
We now see the triangle structure complete, and the market is poised for a decisive breakout in one direction.
🔍 Technical Breakdown:
🟦 Pattern: Contracting Triangle
⏳ Structure: 5-leg consolidation appears complete
📌 Current Price: ~3.68 USD
📈 Bullish Breakout Target: 3.84
A breakout above the upper triangle trendline confirms the bullish momentum.
📉 Bearish Breakdown Target: 3.37
A breakdown below the lower support line will invalidate the bullish structure and may lead to a swift decline.
🧭 Trading Plan:
Watch for a breakout with confirmation volume
Ideal to enter after a breakout retest, especially on the 15m or 1h chart
Set stop-loss just inside the triangle opposite your trade direction
⚠️ Disclaimer:
This analysis is for educational and informational purposes only. It is not financial advice or a recommendation to buy or sell any asset. Always do your own research and consult your financial advisor before making trading decisions.
Disclaimer
The information and publications are not meant to be, and do not constitute, financial, investment, trading, or other types of advice or recommendations supplied or endorsed by TradingView. Read more in the Terms of Use.
Disclaimer
The information and publications are not meant to be, and do not constitute, financial, investment, trading, or other types of advice or recommendations supplied or endorsed by TradingView. Read more in the Terms of Use.