Long
Natural Gas: Commodity Divergences
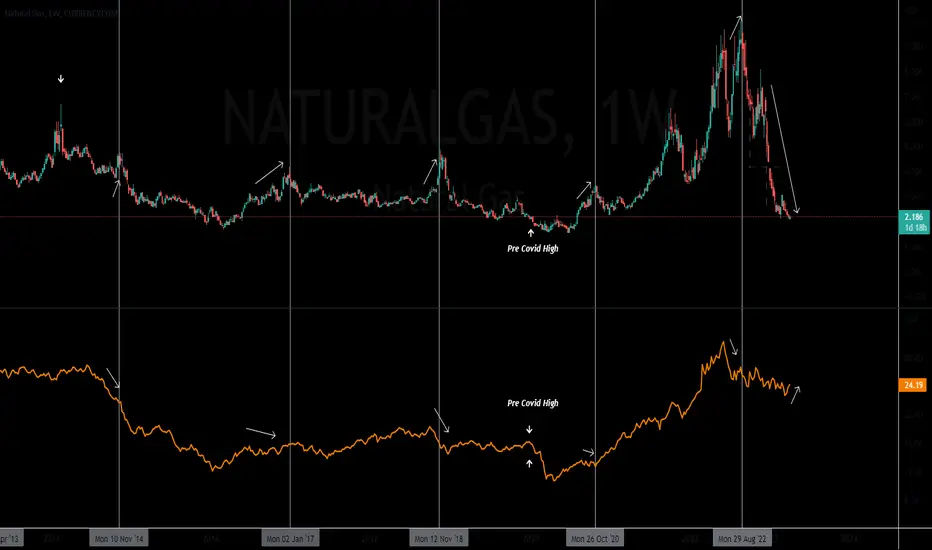
The correlation between DBC (orange line) and Nat Gas is strong.
However, Nat Gas gas does have price history where it diverges, leads & lags the average DBC price action. The white arrows on the screen display the periods where Nat Gas And DBC (in orange) diverge. Some of the divergences have lead to steep pops & drops of mean reversion.
What were seeing now is a massive divergence of about -33%, Nat gas has crashed and is the number one underperforming commodity in this basket.
Nat gas has retraced back to the Pre Covid low levels. Looking at the DBC ETF its about 33% off the Pre Covid Lows.
Over history the correlation usually tightens up and it has a long way to go to close the gap divergence. This presents one of 3 scenarios..
1. Other commodities in the basket collapse
2. Natural Gas Rallies
3. Both options (Our Base Case)
Disclaimer
The information and publications are not meant to be, and do not constitute, financial, investment, trading, or other types of advice or recommendations supplied or endorsed by TradingView. Read more in the Terms of Use.
Disclaimer
The information and publications are not meant to be, and do not constitute, financial, investment, trading, or other types of advice or recommendations supplied or endorsed by TradingView. Read more in the Terms of Use.