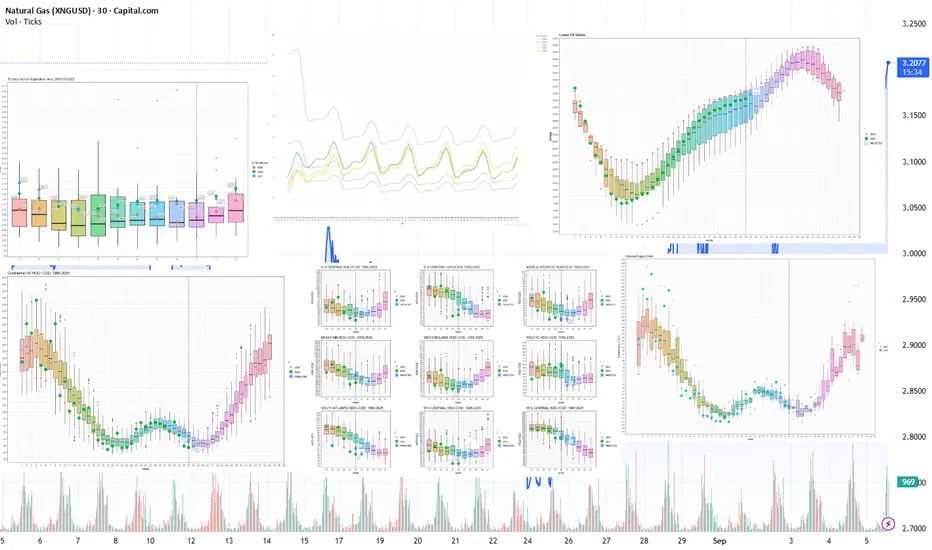
Current prices vs. price spread 10 days before expiration by month since 2010
[Top left graph]
The NGV25 near contract is trading around the median figure but showing high volatility. The next contract, NGX25, as well as the winter 2026 contracts, show moderate contango, but their prices remain within the interquantile range.
Current forward curve vs. 2020-2025
[Top middle graph]
The forward curve shape remains stable and is approaching the configuration of the curves for the same calendar day in 2023 and 2024. This is particularly evident for contracts with delivery dates three years or more in the future. The differences in the short dated contracts are still significant.
Current inventory and forecast for next week compared to 2019-2024
[Top right graph]
For week 35 (Aug. 25-31), storage inventories are forecast to increase by +68 BCF. Fill rates are consistently above the median for the past five years. Injection rates remain positive due to high production and low consumption, mitigating shortage risks ahead of the withdrawal season.
Weekly HDD+CDD total from current NOAA data and forecast for the next two weeks comparing 1994-2024
[Lower left graph]
In the continent as a whole, in the 36th week of this year, the weather in terms of HDD+CDD is significantly below the average for the last 30 years of observations. In the next week, week 37, HDD+CDD is also forecast to be well below average, leading to lower demand for AC power and increasing downward pressure on prices.
Explanation of the chart: candles represent quantiles for 30 years from 1994 to 2024. Red dots 2024, green 2025, blue prediction 2025
Weekly HDD+CDD total from current NOAA data and forecast for the next two weeks compared to 1994-2024 by region
[Lower graph in the middle]
The projections for the major regions are consistent with the general trend: HDD+CDD rates are below the average of the last 30 years of observations.
Weekly cumulative supply/demand differentials compared to 2014-2024
[Lower graph on the right]
The supply-demand balance has narrowed below the decade average. Production has been generally declining and is projected to keep declining. Imports from Canada, exports to Mexico, and LNG supply remain stable, however. Electricity demand has declined due to seasonal factors and warmer weather, while industrial sector demand remains at average levels.
Meanwhile, wind generation increased for this period between 2024 and 2025 by a factor of 4, according to MISO grid operator, from 58,487 Mwh in 2024 to 239,952 Mwh in 2025.
According to PJM grid operator the metric rose by a factor of 2 from 3,312 Mwh in 2024 to 70,070 Mwh in 2025, respectively. This compensated some of the gas consumed, thereby exacerbating the gas storage surplus.
So we are now heading for a 150 unit surplus relative to the 5 year median. Importantly, without lowering the production, new risks are emerging pointing to entering the zone of new considerable gas storage excess capacities, thus putting additional downward price pressure.
Seasonally, September is considered one of the quietest months, when air conditioning is not so active and heating is not yet on. Thus, before the start of the pumping season storages accumulate enough surplus volumes. With the data we have now, there is every reason to expect the start of the season to be 200+ surplus, relative to the average.
Head of Analytics Center at the European broker Mind-Money.eu
👉 mind-money.eu
Website
👉 igorisaev.com/
👉 mind-money.eu
Website
👉 igorisaev.com/
Disclaimer
The information and publications are not meant to be, and do not constitute, financial, investment, trading, or other types of advice or recommendations supplied or endorsed by TradingView. Read more in the Terms of Use.