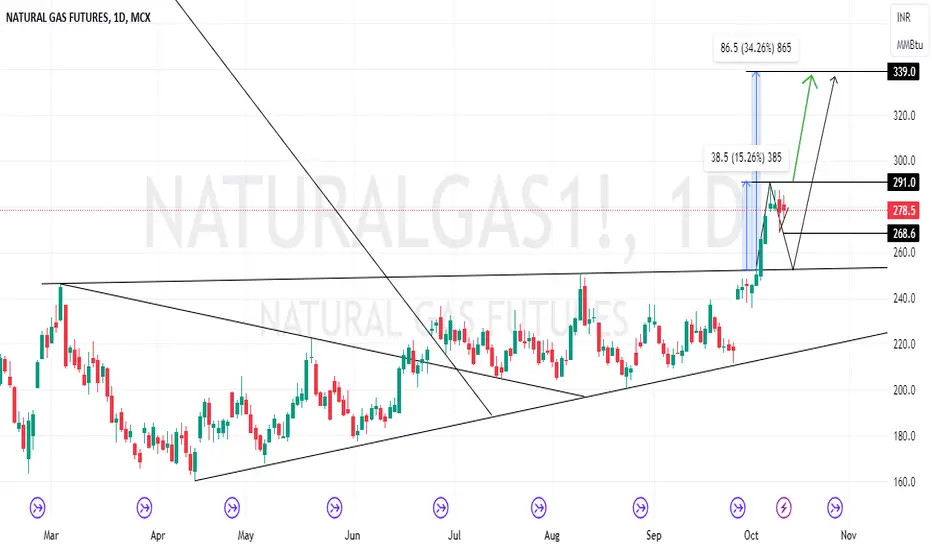
NaturalGas Chart Analysis 13/10/23
Long : Closing above 291 lvl. / 254
Sl : 268 (291 long k liye) / 254
Target : 339
============================
Short : below 268 lvl.
Sl : 280
Target : 255
Enjoy !
Note : If you look at the weekly chart of Natural Gas you will see a Doji candle spinning top. This is a positional view or where I have written intraday in my analysis that you can go long/short when the level becomes active on the same day. Do not mix both the views.
Disclaimer
The information and publications are not meant to be, and do not constitute, financial, investment, trading, or other types of advice or recommendations supplied or endorsed by TradingView. Read more in the Terms of Use.
Disclaimer
The information and publications are not meant to be, and do not constitute, financial, investment, trading, or other types of advice or recommendations supplied or endorsed by TradingView. Read more in the Terms of Use.