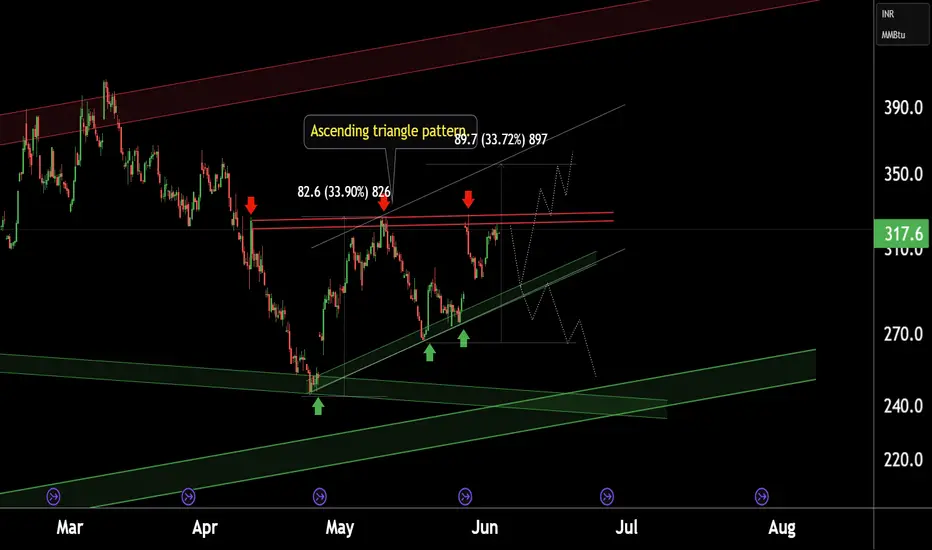
This is the 4 hour chart of NaturalGas1!.
Natural Gas is trading near the resistance of an ascending triangle pattern at 325-332 range.
If this level is sustain,we may see pattern support at 285-290 range
If Natural Gas breaks out above the resistance, it may lead to a new high with a potential upside of 33-34% return, targeting the upper boundary of the channel.
If it gives a breakdown, it may form a new low with further downside potential.
Trade active
The initial target has been met now monitor for a potential breakout before considering the next move.@RahulSaraoge
Connect us at t.me/Fivecirclesofficial
Connect us at t.me/Fivecirclesofficial
Disclaimer
The information and publications are not meant to be, and do not constitute, financial, investment, trading, or other types of advice or recommendations supplied or endorsed by TradingView. Read more in the Terms of Use.
@RahulSaraoge
Connect us at t.me/Fivecirclesofficial
Connect us at t.me/Fivecirclesofficial
Disclaimer
The information and publications are not meant to be, and do not constitute, financial, investment, trading, or other types of advice or recommendations supplied or endorsed by TradingView. Read more in the Terms of Use.