Nava Ltd
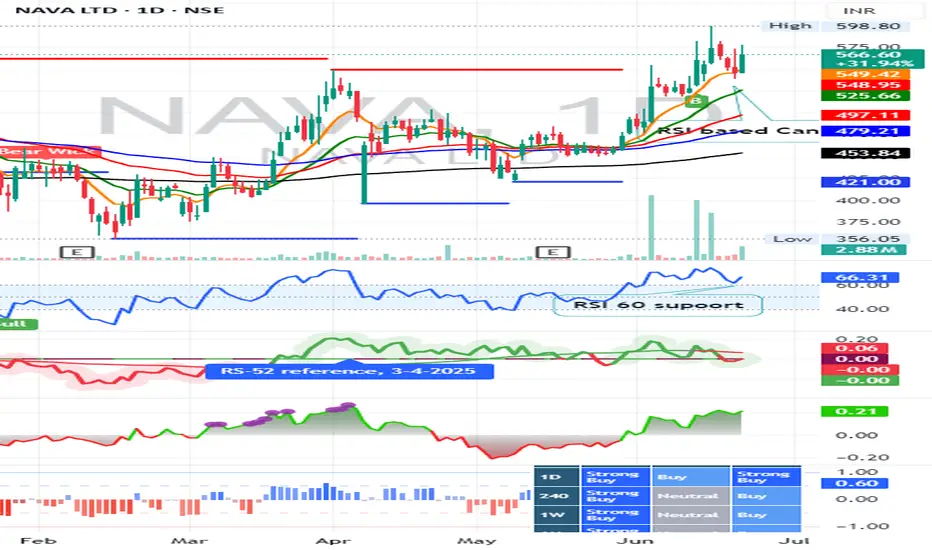
RSI Based Strategy
Daily Chart RSI taken support @ 60
Weekly / Monthly RSI above 60
Support 538
Resistance 573
1. There is also VCP pattern
2. Flag Pattern (support 9 EMA then high cross upside
3. Long leg candle also closed above 559
RSI Based Strategy
Daily Chart RSI taken support @ 60
Weekly / Monthly RSI above 60
Support 538
Resistance 573
1. There is also VCP pattern
2. Flag Pattern (support 9 EMA then high cross upside
3. Long leg candle also closed above 559
Trade active
589 HighNote
598 HIghNote
keep trackNote
603 nowDisclaimer
The information and publications are not meant to be, and do not constitute, financial, investment, trading, or other types of advice or recommendations supplied or endorsed by TradingView. Read more in the Terms of Use.
Disclaimer
The information and publications are not meant to be, and do not constitute, financial, investment, trading, or other types of advice or recommendations supplied or endorsed by TradingView. Read more in the Terms of Use.