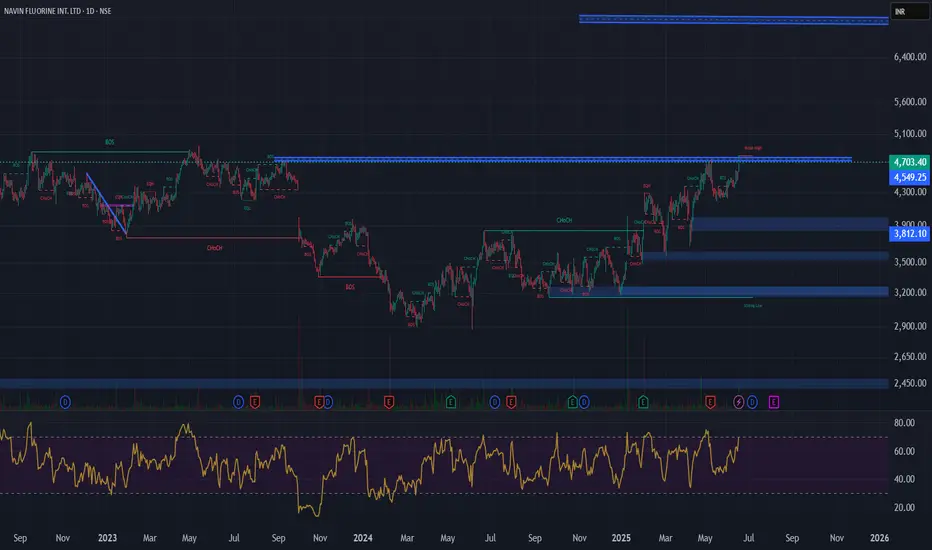
Current Price: ₹4,703
Technical Analysis:
Cup & Handle Breakout Pattern: The provided chart for NAVIN FLUORINE INT. LTD. shows a pattern that resembles a Cup & Handle. The current price action indicates it is at or near a potential breakout level.
Waiting for Confirmation: Your statement "Waiting for confirmation" is crucial. A confirmed breakout typically involves the price sustaining above the resistance level with strong trading volume.
Immediate Target: ₹7,000
Time Frame: 6 months to 1 year.
Fundamental Analysis:
Sales (Revenue from Operations): Consistently growing over the years, from ₹486 Cr in Mar 2014 to ₹2,349 Cr in Mar 2025.
Operating Profit: Shows a strong upward trend, from ₹66 Cr in Mar 2014 to ₹534 Cr in Mar 2025.
Net Profit: Also shows consistent growth, from ₹68 Cr in Mar 2014 to ₹289 Cr in Mar 2025.
EPS in Rs.: Increased from ₹13.47 in Mar 2014 to ₹58.19 in Mar 2025. This indicates healthy year-on-year growth in earnings.
Compounded Sales Growth: Healthy growth with 14% (TTM), 17% (3 Years), 17% (5 Years), and 15% (10 Years).
Compounded Profit Growth: Very strong growth with 25% (TTM), -7% (3 Years), and 20% (10 Years). The negative 3-year profit growth needs to be investigated, as the net profit has consistently increased in the past 3 years (258 Cr in Mar 2022, 375 Cr in Mar 2023, 270 Cr in Mar 2024, 289 Cr in Mar 2025). This might be due to a specific high base year or non-recurring items impacting the compounded calculation for that period.
Return on Equity (ROE): Strong and consistent, with 12% (Last Year), 13% (3 Years), 14% (5 Years), and 16% (10 Years).
Dividend Payout %: Consistent dividend payouts, with 21% in Mar 2025.
Stock P/E: While not provided in the specific image for Navin Fluorine's fundamental ratios, based on the current price of ₹4703 and FY25 EPS of ₹58.19, the trailing P/E would be approximately 80.82. This is a very high P/E ratio, indicating significant growth expectations are priced into the stock.
Corporate Actions & Latest News:
Dividends: The company has a consistent history of paying dividends.
Capacity Expansion/R&D: As a specialty chemicals and fluorochemicals company, corporate actions and news for Navin Fluorine often revolve around:
New project announcements or capacity expansions to meet growing demand.
R&D initiatives for new products or applications.
Strategic partnerships or collaborations.
Client wins in niche chemical segments.
Q4 FY25 Results: The latest news would include the Q4 FY25 financial results, which show a Net Profit of ₹289 Cr.
Company Order Book:
For a specialty chemicals company like Navin Fluorine, the "order book" typically includes long-term contracts with key clients and new project wins. A growing sales trend suggests a healthy order pipeline.
Overall Assessment:
Navin Fluorine International Ltd. presents a fundamentally strong picture with consistent growth in sales and net profit, along with robust profitability ratios like ROE. This strong fundamental performance supports the company's premium valuation.
The Cup & Handle breakout pattern is a bullish technical indicator. If confirmed with strong volume, it could potentially lead to the stock moving towards higher levels.
Key Considerations:
High Valuation: The calculated P/E of approximately 80.82 is very high. This means the market is already pricing in substantial future growth. The company needs to continue delivering exceptional results to justify and sustain this valuation.
Confirmation of Breakout: It's crucial to wait for proper confirmation of the Cup & Handle breakout with strong volume to validate the technical signal.
Profit Growth Anomaly: Investigate the negative "Compounded Profit Growth" for 3 years, despite the increasing net profit trend shown in the table. This might be a calculation anomaly or specific high-base effect.
Given the strong underlying business, consistent growth in key financial metrics, and the bullish technical pattern, the immediate target of ₹7,000, while ambitious, could be plausible within the 6-month to 1-year timeframe, provided the technical breakout is confirmed and the company continues its strong fundamental performance.
Disclaimer: This analysis is for informational purposes only and does not constitute investment advice. Investing in stocks, especially those with high valuations, carries inherent risks. Always conduct your own thorough research, carefully analyze the stock chart, assess your risk tolerance, and consult with a qualified financial advisor before making any investment decisions. The stock market carries inherent risks.
Related publications
Disclaimer
The information and publications are not meant to be, and do not constitute, financial, investment, trading, or other types of advice or recommendations supplied or endorsed by TradingView. Read more in the Terms of Use.
Related publications
Disclaimer
The information and publications are not meant to be, and do not constitute, financial, investment, trading, or other types of advice or recommendations supplied or endorsed by TradingView. Read more in the Terms of Use.