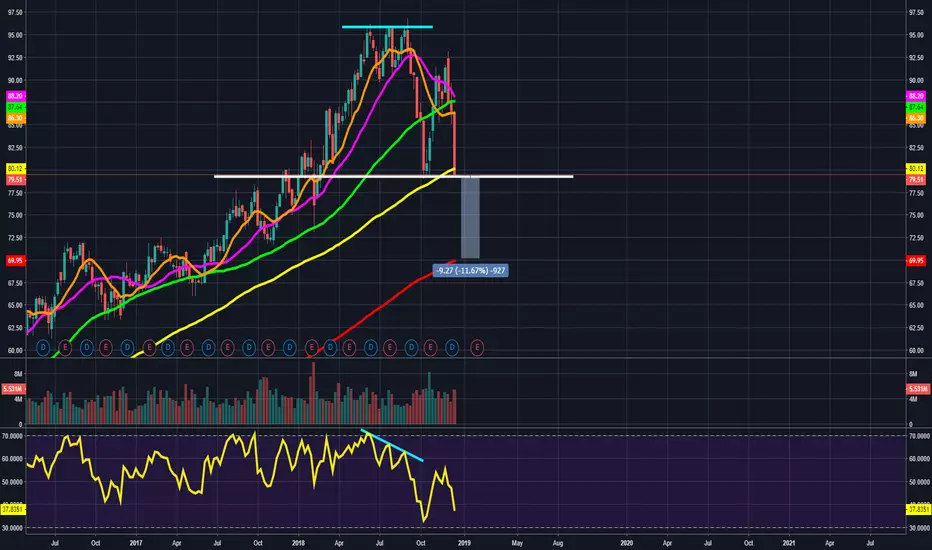
The NASDAQ is currently sitting on the 100 weekly moving average and on a previous support zone, but I suspect it will be broken and we will come down to test the 200 weekly moving average. The overall market sentiment has turned very bearish. I do want to point out, we saw a triple top formation form (shown by the light-blue line on the price action) and we saw the RSI make a lower-high after each attempt to break that high. This is referred to as a Bearish Divergence, and we saw it play out because after the third touch that unsuccessfully broke that peak, price dropped sharply. We could be now entering into a pretty critical time for the stock market, because if we start to break some of these larger weekly moving averages, but could be setting up for downside as we enter into 2019.
Moving average guide (All in the weekly time-frame for this chart):
10 MA in Orange
20 MA in Pink
50 MA in Green
100 MA in Yellow
200 MA in Red
What to watch for:
-A break of the 100 weekly moving average, and a retest of the 200 weekly moving average.
Moving average guide (All in the weekly time-frame for this chart):
10 MA in Orange
20 MA in Pink
50 MA in Green
100 MA in Yellow
200 MA in Red
What to watch for:
-A break of the 100 weekly moving average, and a retest of the 200 weekly moving average.
FTX US: ftx.us/
Sign up for Binance US here: binance.us/?ref=35000668
Sign up for Binance US here: binance.us/?ref=35000668
Disclaimer
The information and publications are not meant to be, and do not constitute, financial, investment, trading, or other types of advice or recommendations supplied or endorsed by TradingView. Read more in the Terms of Use.