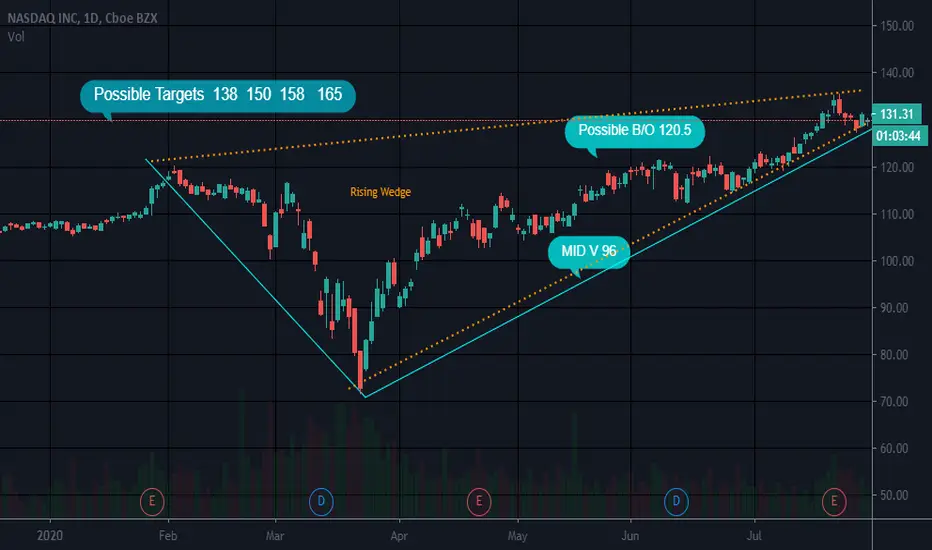
NDAQ is riding the bottom trend line of it's V Bottom and rising wedge patterns. It broke up from an ascending triangle at 123ish...so possiblly strong support at that price. The top trend line of a triangle can serve as support after the break out. It serves as resistance before the break out
It has actually broken the rising wedge bottom trend line by a smidgen (is that a word) lol
Seems to be consolidating. Rising wedges have a bearish bias so I will stay on the sidelines and watch this one for a bit. I would go long when I see that the rising wedge pattern does not interfere or is broken one way or the other. Some stocks do not fall out very far. Others do..ie LLY..
Monthly candle is a red doji so not help there. Bollinger bands are contracting around price which usually means a break up or down is coming
Not a recommendation
Disclaimer
The information and publications are not meant to be, and do not constitute, financial, investment, trading, or other types of advice or recommendations supplied or endorsed by TradingView. Read more in the Terms of Use.
Disclaimer
The information and publications are not meant to be, and do not constitute, financial, investment, trading, or other types of advice or recommendations supplied or endorsed by TradingView. Read more in the Terms of Use.