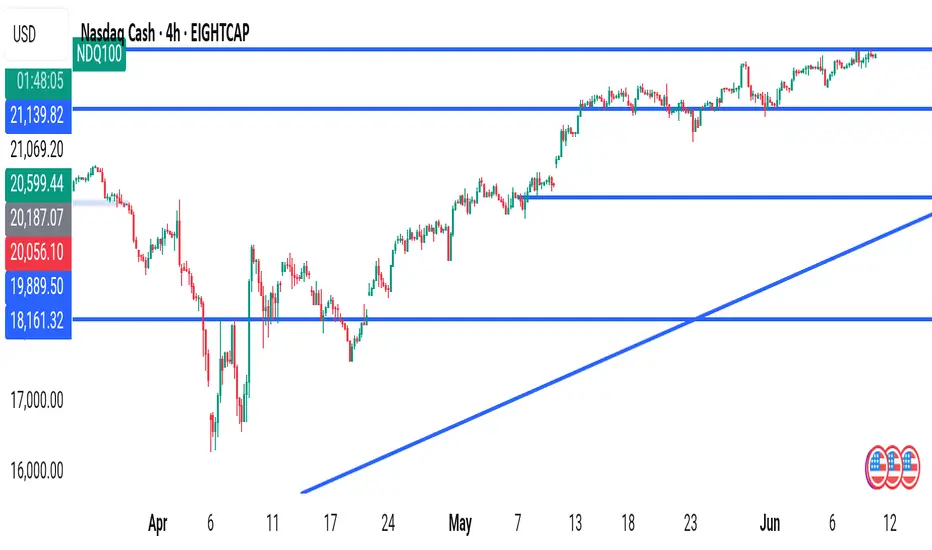
The Nasdaq 100 has been on a steady bullish trend since mid-April, respecting a beautiful ascending trendline shown in blue. As of now, the price is sitting at 21,905, right under a critical resistance zone around 21,920–21,950.
Here are the key levels marked on the chart:
🔹 Resistance:
21,920–21,950 (current testing zone)
21,139.82 (previous local high)
🔹 Support Zones:
20,599.44
20,056.10
19,889.50
18,161.32 (major swing low)
🔹 Trendline Support:
Starting from April lows, this trendline continues to hold as dynamic support, adding to the bullish momentum.
---
📊 Price Action Insights:
✅ Bullish structure with higher highs and higher lows
✅ Strong bullish candles leading into resistance
✅ Consolidation near the highs — potential breakout brewing
✅ Price staying above the 20,599 and 20,056 key support zones
---
🧨 Potential Trade Setups:
📈 Bullish Breakout Scenario:
A clean break and close above 21,950 on the 4H could trigger a bullish run toward 22,200+.
📉 Rejection Scenario:
Failure to break above this zone might lead to a retest of 20,599.44 or the trendline support for a better entry.
---
📌 Key Events to Watch:
🇺🇸 US Market Holidays and Data Releases (circled in red) could add volatility — stay alert!
---
🗣️ What’s Your Bias?
🔽 Do you think Nasdaq will break higher or retrace back to the trendline support?
💬 Drop your analysis below! Let’s discuss 💬
👍 Like & Follow if you find this helpful – more setups coming soon!
#NASDAQ100 #NDQ100 #TechnicalAnalysis #PriceAction #TradingView #StockMarket #BreakoutTrading #Trendline #SupportAndResistance #FrankFx14
✅JOIN FREE SIGNALS t.me/frankfxforextrade
✅ AUTOMATED BOT: bot.frankfxx.com
✅AI CRYPTO SIGNAL:crypto.frankfxx.com
✅STORE:selar.com/m/ukwuezefrankfx
✅AI GOLD INDICES AND FOREX SIGNALS
trade.frankfxx.com
✅ AUTOMATED BOT: bot.frankfxx.com
✅AI CRYPTO SIGNAL:crypto.frankfxx.com
✅STORE:selar.com/m/ukwuezefrankfx
✅AI GOLD INDICES AND FOREX SIGNALS
trade.frankfxx.com
Disclaimer
The information and publications are not meant to be, and do not constitute, financial, investment, trading, or other types of advice or recommendations supplied or endorsed by TradingView. Read more in the Terms of Use.