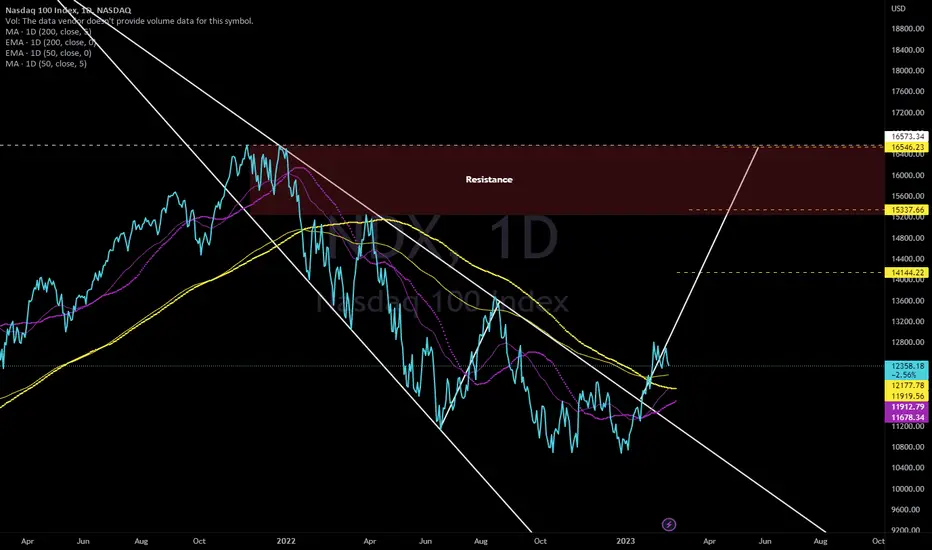
As other major markets presently indicate similar targets, Nasdaq index also shows a pattern with measured targets pointing towards a same or slightly lower high double-top.
I'm seeing this as a possibility across stock and crypto markets in correlation with a long-term bullish US Dollar Currency Index (DXY) that recently experienced a strong correction and may be preparing for another leg up.
Pre-requisites
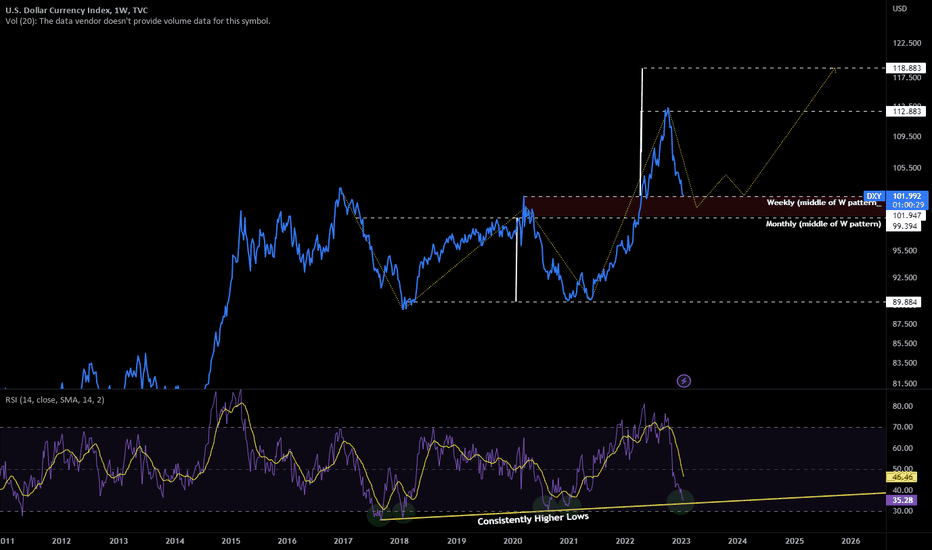
This and the other double-top ideas shown below all hinge on DXY not continuing to drop, and also not immediately spiking back up. It would probably need to at least spend 2-3 (or up to 6-9 months) consolidating in the area where it is now (99-105 or so), and then move up.
DXY and how it relates
First some general thoughts on DXY and how it correlates with stock/crypto markets:
Other Potential Double Top Patterns in US Stock and International Crypto Markets
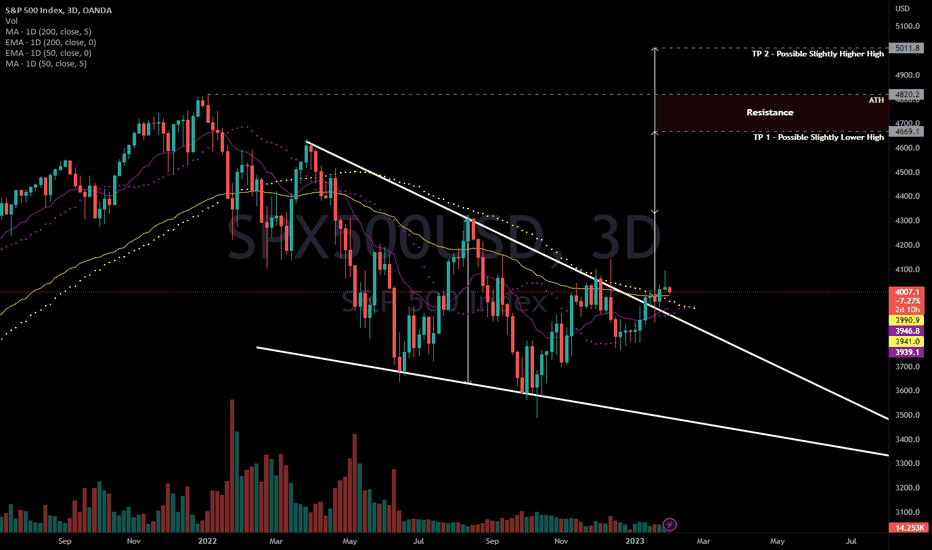
SP500 Measured Move towards same or slightly lower or higher high double-top:
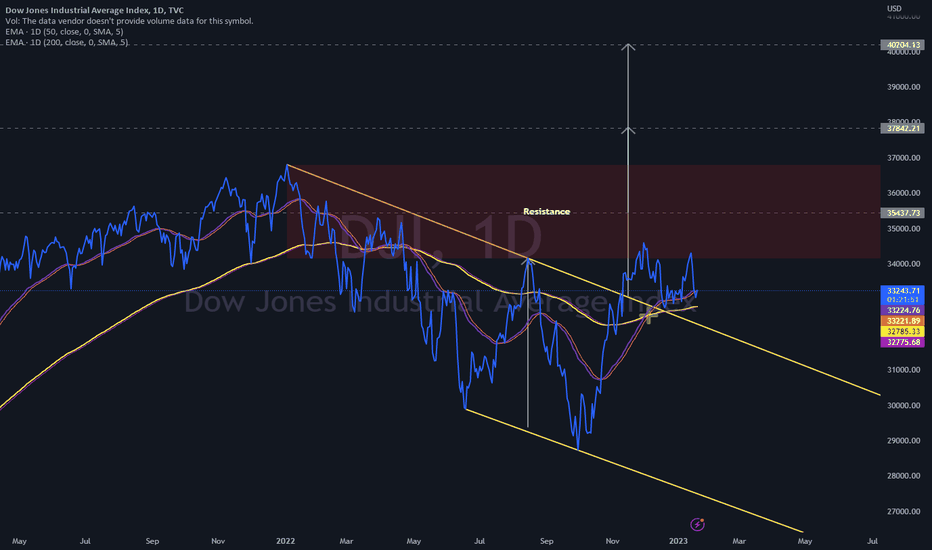
Dow Jones Index Measured Move towards slightly higher high double-top, likely a new but weak ATH:
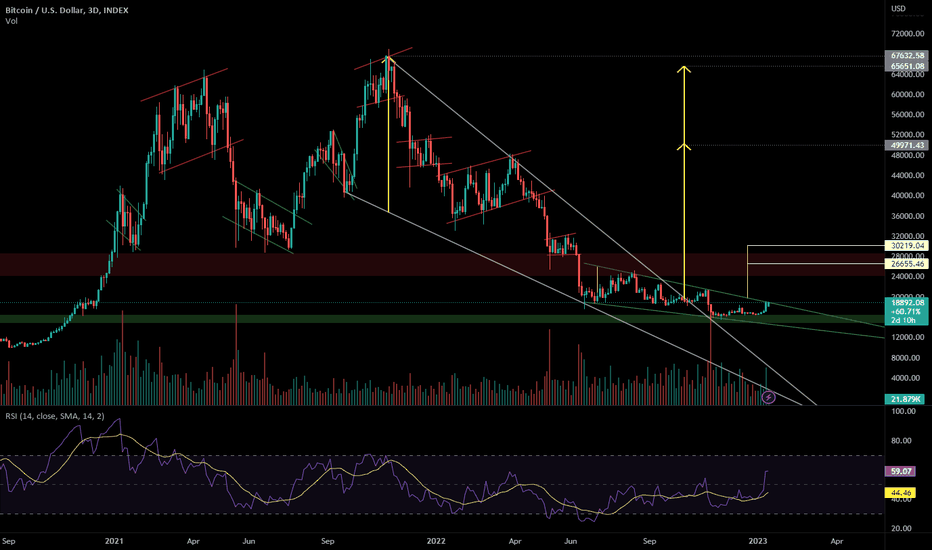
Bitcoin Measured Move towards same or slightly lower high double-top:
DXY Correlation of Peaks vs Troughs in Crypto and Stock Markets
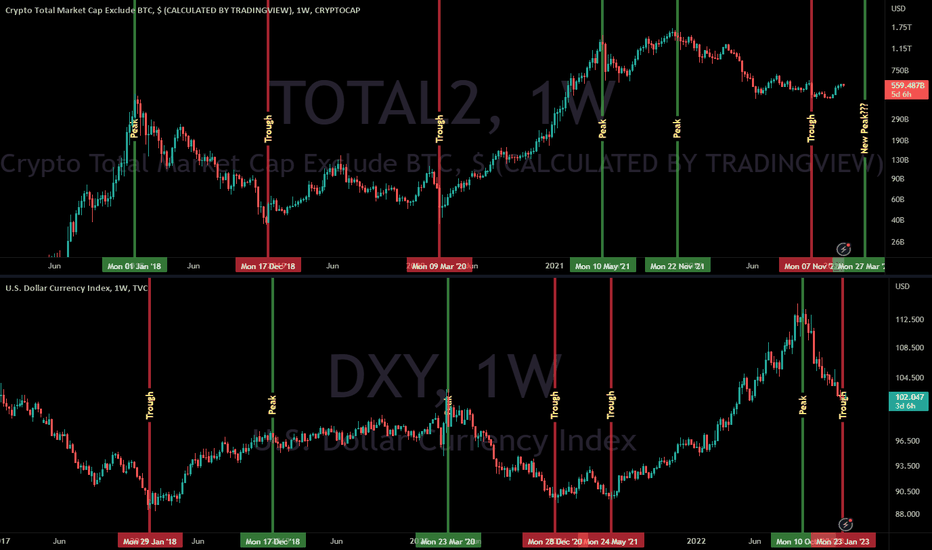
DXY Peaks/Troughs Correlation to Total2 Troughs/Peaks:
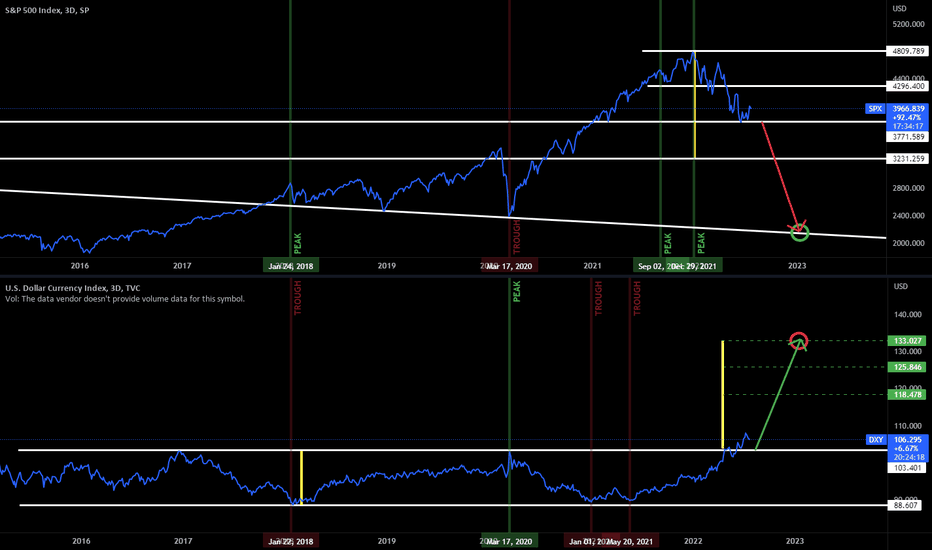
DXY Peaks/Troughs Correlation with SP500 Troughs/Peaks - this chart is older and has since made a new peak/trough for DXY/SPX and is likely headed from current trough to new peak for SP500 (first a double-top prior to suggested recession):
I'm seeing this as a possibility across stock and crypto markets in correlation with a long-term bullish US Dollar Currency Index (DXY) that recently experienced a strong correction and may be preparing for another leg up.
Pre-requisites
This and the other double-top ideas shown below all hinge on DXY not continuing to drop, and also not immediately spiking back up. It would probably need to at least spend 2-3 (or up to 6-9 months) consolidating in the area where it is now (99-105 or so), and then move up.
DXY and how it relates
First some general thoughts on DXY and how it correlates with stock/crypto markets:
Other Potential Double Top Patterns in US Stock and International Crypto Markets
SP500 Measured Move towards same or slightly lower or higher high double-top:
Dow Jones Index Measured Move towards slightly higher high double-top, likely a new but weak ATH:
Bitcoin Measured Move towards same or slightly lower high double-top:
DXY Correlation of Peaks vs Troughs in Crypto and Stock Markets
DXY Peaks/Troughs Correlation to Total2 Troughs/Peaks:
DXY Peaks/Troughs Correlation with SP500 Troughs/Peaks - this chart is older and has since made a new peak/trough for DXY/SPX and is likely headed from current trough to new peak for SP500 (first a double-top prior to suggested recession):
Note
Update - bounce up from the 200 day EMA (or the green box here) would confirm smaller W pattern with a TP 2 near halfway to TP 1 on the larger wedge break:Meanwhile, we'd need to see DXY bounce down from the 200 EMA or MA (or the green box here):
Related publications
Disclaimer
The information and publications are not meant to be, and do not constitute, financial, investment, trading, or other types of advice or recommendations supplied or endorsed by TradingView. Read more in the Terms of Use.
Related publications
Disclaimer
The information and publications are not meant to be, and do not constitute, financial, investment, trading, or other types of advice or recommendations supplied or endorsed by TradingView. Read more in the Terms of Use.