Technical Analysis and Outlook
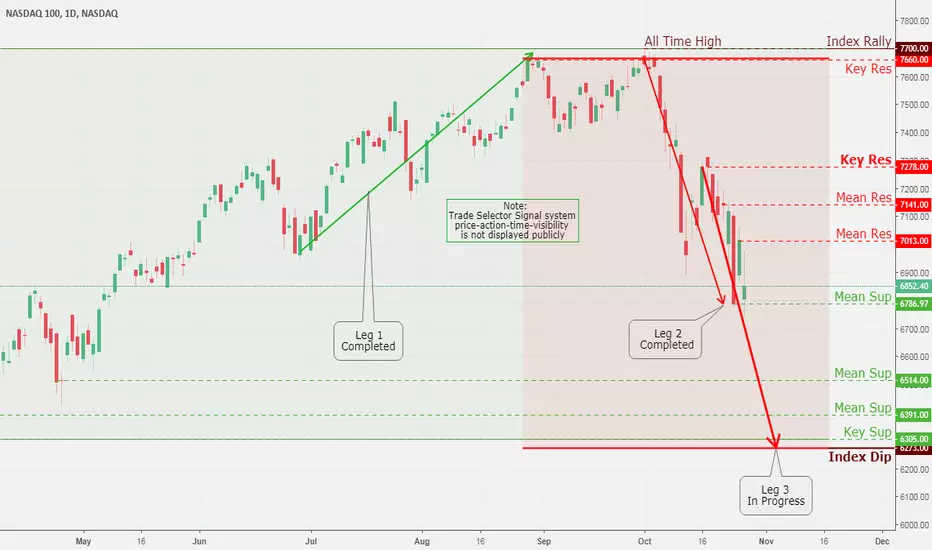
The NASDAQ 100 finished lower coming from of Mean Resistance 7013 and bouncing off significant Mean Support 6786. The next stage for transforming from bearish sentiment to bullish Dead-Cat-Bounce is Mean Resistance 7013. If all else fails, the tech index will take us to the next significant Mean Support located at 6514 and eventually to the Index Dip 6273.
The NASDAQ 100 finished lower coming from of Mean Resistance 7013 and bouncing off significant Mean Support 6786. The next stage for transforming from bearish sentiment to bullish Dead-Cat-Bounce is Mean Resistance 7013. If all else fails, the tech index will take us to the next significant Mean Support located at 6514 and eventually to the Index Dip 6273.
Note
October 31The Nasdaq index closed higher on Tuesday with a psychological bounce following striking six-month lows on Monday. There does exist robust near-term technical facts that the index is heading to Mean Resistance 7013. (See Market Commentary)
Disclaimer
The information and publications are not meant to be, and do not constitute, financial, investment, trading, or other types of advice or recommendations supplied or endorsed by TradingView. Read more in the Terms of Use.
Disclaimer
The information and publications are not meant to be, and do not constitute, financial, investment, trading, or other types of advice or recommendations supplied or endorsed by TradingView. Read more in the Terms of Use.