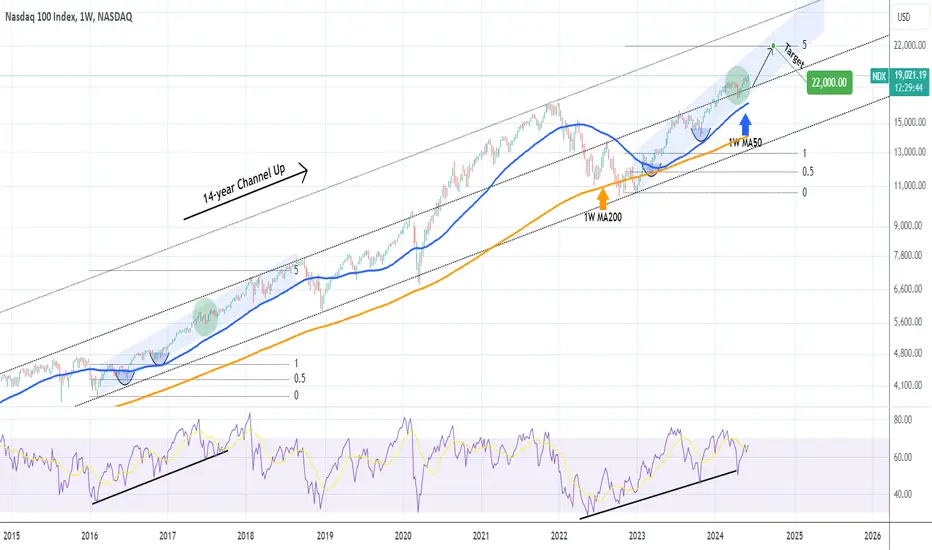
Nasdaq (NDX) has been trading within a (blue) Channel Up since basically the market bottom of the inflation crisis in October 2022. On the bigger picture, this is the technical Bullish Leg of the 14-year Channel Up and is supported by the 1W MA50 (blue trend-line) since March 13 2023.
Based on the 1W RSI pattern, we have previously seen such Bullish Leg within the long-term Channel Up supported by the 1W MA50, back on the February 08 2016 bottom. As you can see on this 1W chart, both Bullish Legs (Channel Up patterns) made their first pull-back on the 0.5 Fibonacci retracement level. In June 2018, the previous fractal reached the 5.0 Fibonacci extension and shortly after, the index corrected aggressively back at the bottom of the 14-year Channel Up.
We expect Nasdaq to hit again the 5.0 Fib ext sooner or later but most likely before the year is over. This gives us a medium-term Target of 22000.
-------------------------------------------------------------------------------
** Please LIKE 👍, FOLLOW ✅, SHARE 🙌 and COMMENT ✍ if you enjoy this idea! Also share your ideas and charts in the comments section below! This is best way to keep it relevant, support us, keep the content here free and allow the idea to reach as many people as possible. **
-------------------------------------------------------------------------------
💸💸💸💸💸💸
👇 👇 👇 👇 👇 👇
👑Best Signals (Forex/Crypto+70% accuracy) & Account Management (+20% profit/month on 10k accounts)
💰Free Channel t.me/tradingshotglobal
🤵Contact info@tradingshot.com t.me/tradingshot
🔥New service: next X100 crypto GEMS!
💰Free Channel t.me/tradingshotglobal
🤵Contact info@tradingshot.com t.me/tradingshot
🔥New service: next X100 crypto GEMS!
Disclaimer
The information and publications are not meant to be, and do not constitute, financial, investment, trading, or other types of advice or recommendations supplied or endorsed by TradingView. Read more in the Terms of Use.