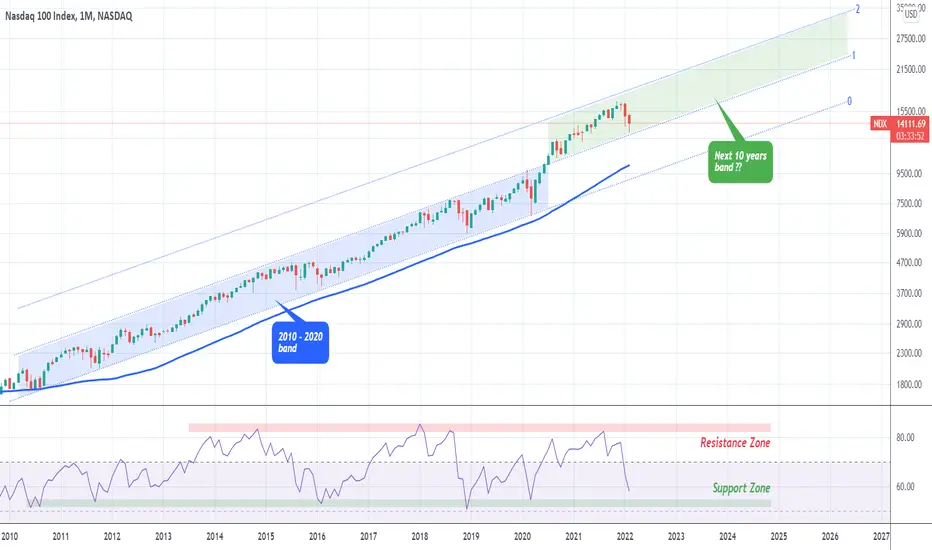
This is Nasdaq on the 1M time-frame since the recovery from the sub-prime mortgage crisis was set in motion in 2010.
As shown, the index has been trading within a Channel Up (log chart) from 2010 until mid 2020. Then in July 2020, it appears that NDX switched bands to one zone higher, illustrated perfectly by using the Fibonacci Channel extensions. As you see, since July 2020, the Fib 1.0 level which was previously the Resistance (top/ Higher Highs trend-line) of the former 2010 - 2020 Channel, has turned into a Support (bottom/ Higher Lows trend-line), and is being currently tested by the current 1M candle of February.
Every such Channel bottom test, has been a unique long-term buy opportunity during these +10 years. With the 1M MA50 (blue trend-line) rising rapidly towards the 1.0 Fib level, do you think that will turn into a Support for the next 10 years? Based on this pattern, that looks like the most probable scenario.
P.S. Check also the very consistent Resistance and Support levels on the RSI.
--------------------------------------------------------------------------------------------------------
** Please support this idea with your likes and comments, it is the best way to keep it relevant and support me. **
--------------------------------------------------------------------------------------------------------
👑Best Signals (Forex/Crypto+70% accuracy) & Account Management (+20% profit/month on 10k accounts)
💰Free Channel t.me/tradingshotglobal
🤵Contact info@tradingshot.com t.me/tradingshot
🔥New service: next X100 crypto GEMS!
💰Free Channel t.me/tradingshotglobal
🤵Contact info@tradingshot.com t.me/tradingshot
🔥New service: next X100 crypto GEMS!
Disclaimer
The information and publications are not meant to be, and do not constitute, financial, investment, trading, or other types of advice or recommendations supplied or endorsed by TradingView. Read more in the Terms of Use.