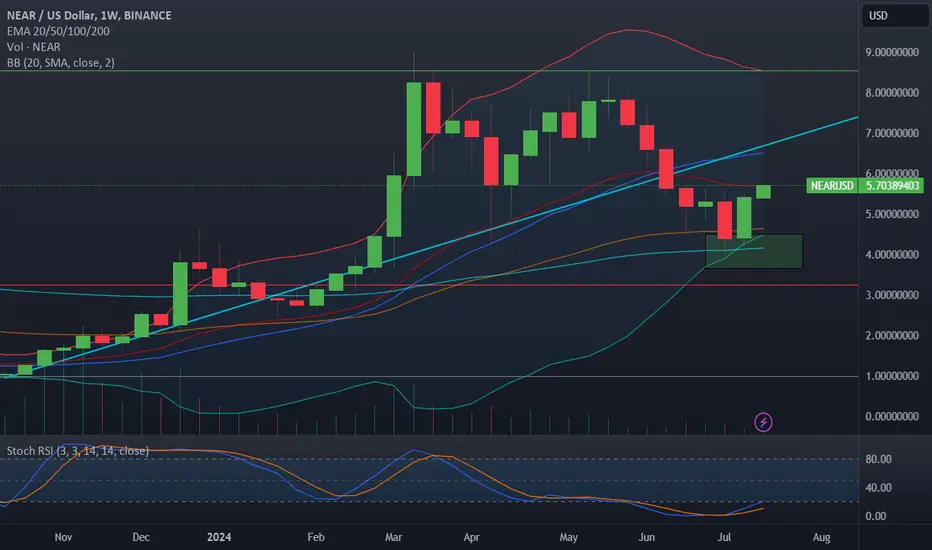
NEAR finally tests the 20EMA after bouncing off the demand zone, this token is very strong relative to the market. The dip into demand was shallow. My next area of resistance is the teal momentum trend line. Similar to my RNDR chart, I added Bollinger bands to show context of a likely bottom. This chart is a bit more bullish as the stochastic RSI has already started to point up on the weekly.
-My plan is to sell 25% at 20$, then 50% at 50$
-My plan is to sell 25% at 20$, then 50% at 50$
Disclaimer
The information and publications are not meant to be, and do not constitute, financial, investment, trading, or other types of advice or recommendations supplied or endorsed by TradingView. Read more in the Terms of Use.
Disclaimer
The information and publications are not meant to be, and do not constitute, financial, investment, trading, or other types of advice or recommendations supplied or endorsed by TradingView. Read more in the Terms of Use.