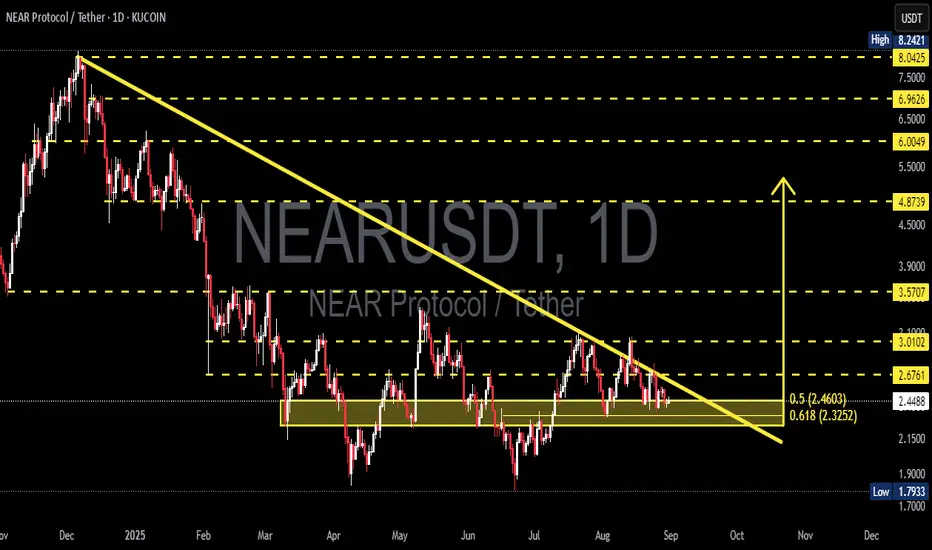
NEAR Protocol (NEAR/USDT) is currently trading at a very decisive point. The chart is showing a clear Descending Triangle pattern: sellers keep pressing the price lower with a series of lower highs, while buyers are defending a strong support zone around 2.325–2.460 (Fibonacci 0.618–0.5).
This is a make-or-break level: NEAR is either preparing for a major bullish reversal, or a breakdown that could extend the bearish trend.
---
🔹 Pattern & Structure Analysis
Main pattern: Descending Triangle (generally bearish, but a breakout above can flip the bias to bullish).
Key Support Zone: 2.325 – 2.460 (Fibo confluence).
Trendline Resistance: descending yellow line that has capped prices for months.
Key Levels to watch:
Critical Support: 2.325 – 2.460
Major Support: 1.793 (previous low)
Resistances: 2.676 → 3.010 → 3.570
Higher Resistances: 4.873 → 6.00 → 6.96 → 8.04
---
📈 Bullish Scenario
Trigger: Daily close above the descending trendline + a clear break of 2.676.
Stronger confirmation: breakout and hold above 3.010.
Upside targets:
Target 1: 3.010
Target 2: 3.570
Extended: 4.873 – 6.00
Extra signal: strong breakout volume + successful retest of broken trendline as support.
Invalidation: if price fails to hold above 2.325 after breakout.
---
📉 Bearish Scenario
Trigger: Daily close below 2.325 (Fibo 0.618).
Downside targets:
Target 1: 1.793 (previous low)
Target 2 (aggressive measured move projection): ~1.08
Extra signal: declining buy volume + strong red candle closing below support.
Invalidation: if price reclaims 2.460–2.676 after breakdown.
---
⚖️ Conclusion
NEAR is standing at a key decision zone.
A bullish breakout above the descending trendline could spark a trend reversal with potential rally toward 3.0 – 3.57.
A bearish breakdown below 2.325 would confirm bearish continuation, targeting 1.79 and potentially lower.
In short, the 2.325–2.460 zone is NEAR’s lifeline — holding above it may trigger a reversal, breaking below it could extend the downtrend.
---
📌 Notes
Always wait for daily close confirmation to avoid false breakouts.
Watch volume for breakout/breakdown validation.
Apply proper risk management (cut loss & position sizing).
#NEAR #NEARProtocol #NEARUSDT #Crypto #Altcoins #CryptoAnalysis #DescendingTriangle #SupportResistance #Fibonacci #BullishScenario #BearishScenario
✅ Get Free Signals! Join Our Telegram Channel Here: t.me/TheCryptoNuclear
✅ Twitter: twitter.com/crypto_nuclear
✅ Join Bybit : partner.bybit.com/b/nuclearvip
✅ Benefits : Lifetime Trading Fee Discount -50%
✅ Twitter: twitter.com/crypto_nuclear
✅ Join Bybit : partner.bybit.com/b/nuclearvip
✅ Benefits : Lifetime Trading Fee Discount -50%
Disclaimer
The information and publications are not meant to be, and do not constitute, financial, investment, trading, or other types of advice or recommendations supplied or endorsed by TradingView. Read more in the Terms of Use.