https://tradingview.sweetlogin.com/x/lCiWF8sL/
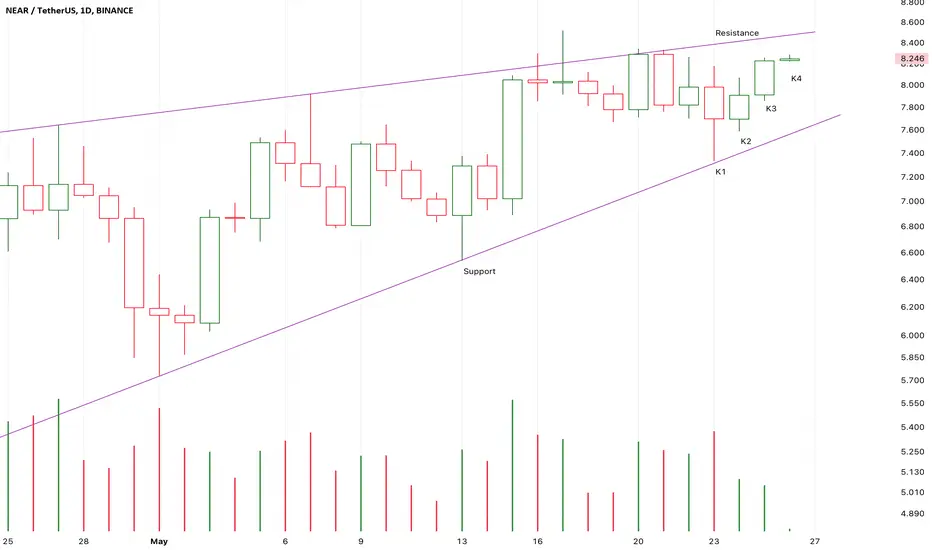
K3 close upon K1 and verified a strong bullish hammer candle of K1,
It seems that the short-term downtrend had been reversed by K1.
If K4 close upon the resistance,
It will be a good place to buy it there.
The risk is the potential bearish wedge pattern,
If the following candle close below the lower limit of wedge,
The risk will surely increase.
Note
K1 and K2 is a strong bearish engulfing pattern,
Both the supply and demand pressure are decreasing.
If the following candles close upon the resistance,
The bull market will keep climbing up to test 10 USDT.
If the following candles close below the support,
A bearish wedge will established here.
The risk will sharply increase.
Long-7.814/Stop-7.668/Target-10
Note
After the bearish engulfing candle K2,
The supply pressure increased.
It is a second bad signals.
If K4 close below the uptrend line,
The risk will sharply increase.
Trade closed: stop reached
Disclaimer
The information and publications are not meant to be, and do not constitute, financial, investment, trading, or other types of advice or recommendations supplied or endorsed by TradingView. Read more in the Terms of Use.
Disclaimer
The information and publications are not meant to be, and do not constitute, financial, investment, trading, or other types of advice or recommendations supplied or endorsed by TradingView. Read more in the Terms of Use.