Hey crypto traders! Let’s zoom into this 1-hour chart, because NEAR is serving up some serious action!
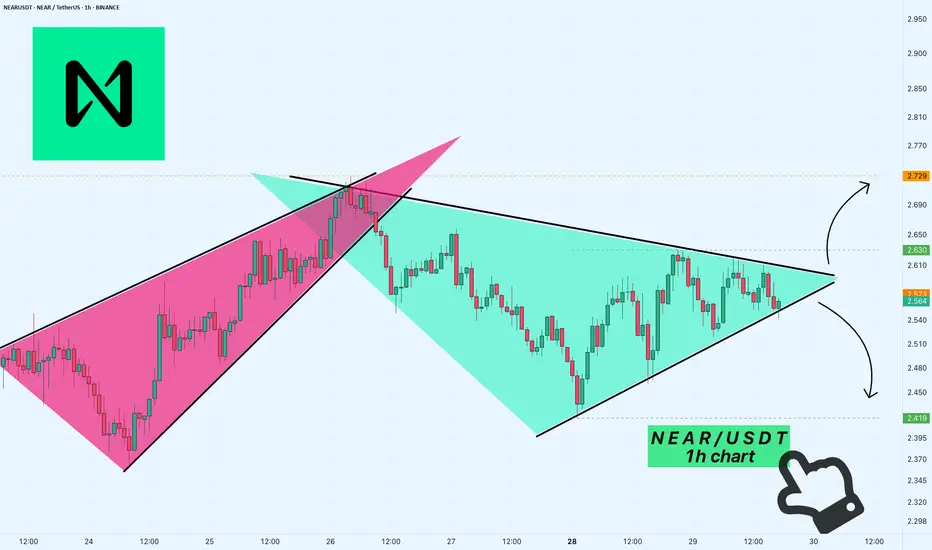
We’ve got a massive triangle forming, with the price squeezing tighter and tighter between converging trendlines. NEAR is currently dancing around $2.466, teasing a breakout after bouncing between resistance at $2.729 and support at $2.419. This pattern is a pressure cooker, and a big move is coming — will it soar to new highs or crash back down?
A bullish breakout above the upper trendline could propel NEAR past $2.610, potentially targeting $2.729 or higher! But if it fails to hold support at $2.540, we might see a dip toward $2.419 or even lower.

Key Levels to Watch:
Resistance: $2.610
Support: $2.540
Breakout Target: $2.729+
Breakdown Risk: $2.419
What’s your take — bullish surge or bearish pullback? Let’s hear your predictions below!
We’ve got a massive triangle forming, with the price squeezing tighter and tighter between converging trendlines. NEAR is currently dancing around $2.466, teasing a breakout after bouncing between resistance at $2.729 and support at $2.419. This pattern is a pressure cooker, and a big move is coming — will it soar to new highs or crash back down?
A bullish breakout above the upper trendline could propel NEAR past $2.610, potentially targeting $2.729 or higher! But if it fails to hold support at $2.540, we might see a dip toward $2.419 or even lower.
Key Levels to Watch:
Resistance: $2.610
Support: $2.540
Breakout Target: $2.729+
Breakdown Risk: $2.419
What’s your take — bullish surge or bearish pullback? Let’s hear your predictions below!
📲 Join Telegram Trading Community: t.me/+5hlxWmhHaKplN2Rk
🎙️ 𝘾𝙊𝙈𝙄𝙉𝙂 𝙎𝙊𝙊𝙉 Daily Live Streams on 🔴 𝗬𝗼𝘂𝗧𝘂𝗯𝗲
🔍 linktr.ee/artemcrypto ✅
🎙️ 𝘾𝙊𝙈𝙄𝙉𝙂 𝙎𝙊𝙊𝙉 Daily Live Streams on 🔴 𝗬𝗼𝘂𝗧𝘂𝗯𝗲
🔍 linktr.ee/artemcrypto ✅
Disclaimer
The information and publications are not meant to be, and do not constitute, financial, investment, trading, or other types of advice or recommendations supplied or endorsed by TradingView. Read more in the Terms of Use.