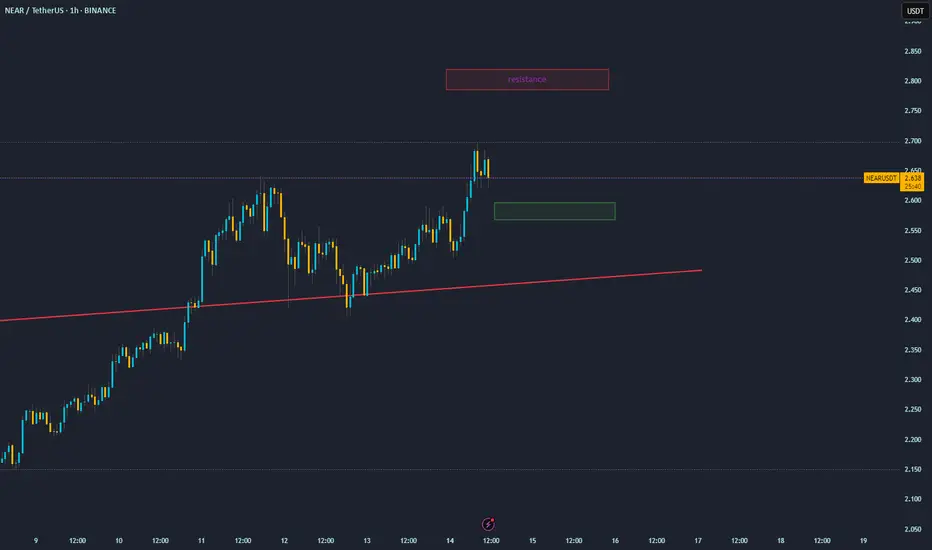
This 1-hour chart for NEAR Protocol (NEAR/USDT) shows a healthy and structured uptrend. The drawn levels outline a clear trading plan based on current momentum and key price zones.
Asset: NEAR Protocol / TetherUS (NEAR/USDT)
Timeframe: 1-Hour (Short-to-medium term outlook)
Overall Trend: The asset is in a clear uptrend, consistently setting higher highs and higher lows, which is a bullish sign.
Key Levels and Indicators
Support Levels (Potential Buy Zones):
Ascending Trendline (Red Line): This diagonal line acts as the backbone of the current rally. The price has respected this line as dynamic support multiple times. As long as the price remains above this trendline, the bullish structure is considered intact.
Demand Zone (Green Box): The area between approximately $2.57 and $2.61 is marked as a key horizontal support or "demand" zone. On any pullback, this is the first area where buyers are likely to show interest.
Resistance Levels (Potential Sell/Target Zones):
Immediate Resistance (~$2.70): The recent peak around $2.70 acts as the first minor hurdle. The price needs to break and hold above this level to continue its ascent.
Primary Target (Red Box): The box labeled "resistance" around $2.80 is the main target for this bullish move. This is a significant level where traders might look to take profits, and selling pressure could increase.
Potential Strategy
The overall strategy shown on the chart is bullish. The plan is to trade with the prevailing uptrend.
A trader might look to enter a long (buy) position on a price dip into one of the support areas:
A pullback into the green demand box (~$2.57 - $2.61).
A bounce off the red ascending trendline.
The ultimate goal for this trade would be the primary resistance target at $2.80. A break and close below the red ascending trendline would likely invalidate the immediate bullish thesis.
Disclaimer
The information and publications are not meant to be, and do not constitute, financial, investment, trading, or other types of advice or recommendations supplied or endorsed by TradingView. Read more in the Terms of Use.
Disclaimer
The information and publications are not meant to be, and do not constitute, financial, investment, trading, or other types of advice or recommendations supplied or endorsed by TradingView. Read more in the Terms of Use.