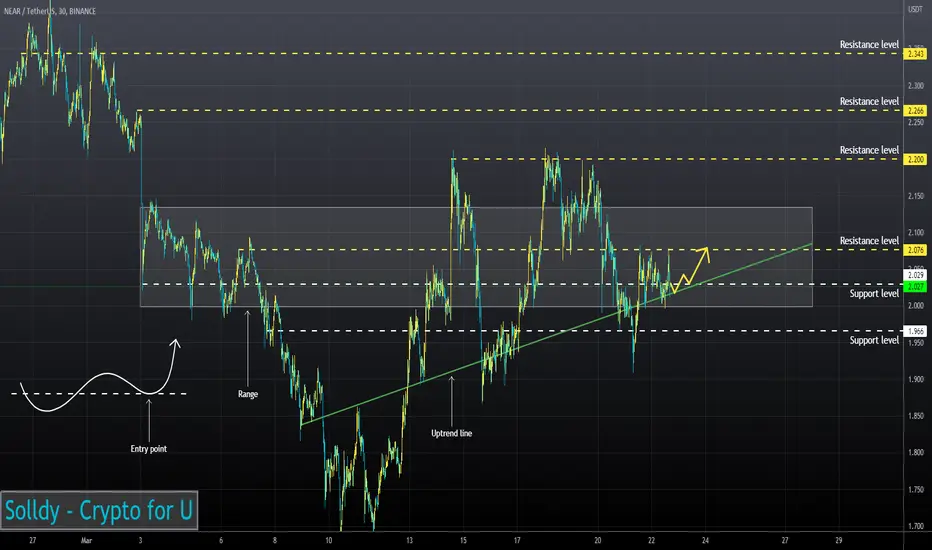
NEAR is trading in a range near the uptrend line.
The RSI chart is moving near neutral values.
The asset will start to rebound and then continue to rise.
The RSI chart is moving near neutral values.
The asset will start to rebound and then continue to rise.
Disclaimer
The information and publications are not meant to be, and do not constitute, financial, investment, trading, or other types of advice or recommendations supplied or endorsed by TradingView. Read more in the Terms of Use.
Disclaimer
The information and publications are not meant to be, and do not constitute, financial, investment, trading, or other types of advice or recommendations supplied or endorsed by TradingView. Read more in the Terms of Use.