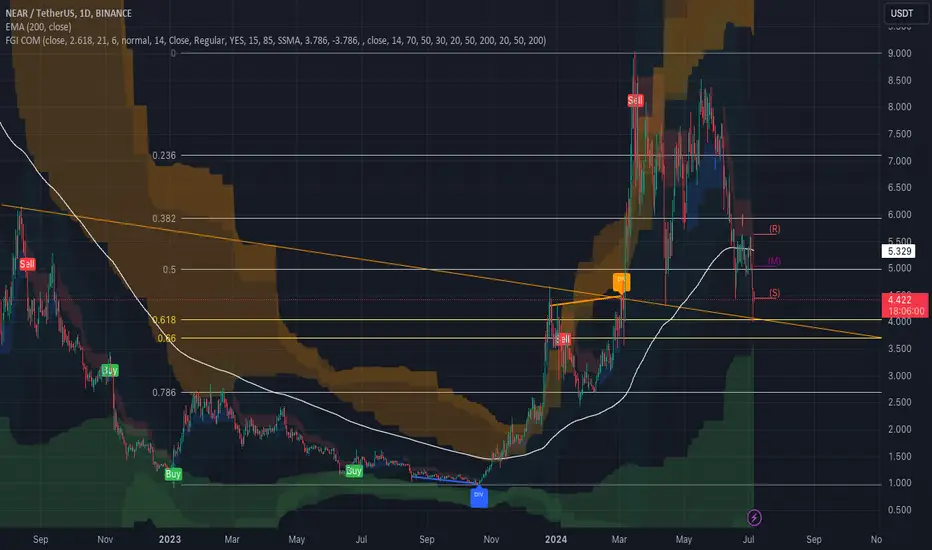
𝗕𝘂𝗹𝗹𝗶𝘀𝗵 𝗦𝗰𝗲𝗻𝗮𝗿𝗶𝗼 📈
If the price breaks above the 200 EMA at $5.329 and clears the immediate resistance levels, we could see a move towards the $6.00 and $7.00 levels. Sustained buying pressure and positive market sentiment could push the price towards the upper Fibonacci levels.
𝗕𝗲𝗮𝗿𝗶𝘀𝗵 𝗦𝗰𝗲𝗻𝗮𝗿𝗶𝗼 📉
If the price fails to break above the 200 EMA and descends below the support at $4.428, it could test lower support levels around $3.50 and $3.00. Continued bearish sentiment and negative news could drive the price lower.
𝗖𝗼𝗻𝗰𝗹𝘂𝘀𝗶𝗼𝗻 📊

 NEARUSDT
While the #NEAR USDT chart shows mixed signals, the bullish divergence and recent "Buy" signal provide a positive outlook. A confiRRMED breakout above the 200 EMA and the descending trendline would solidify the bullish case, targeting higher resistance levels.
If the price breaks above the 200 EMA at $5.329 and clears the immediate resistance levels, we could see a move towards the $6.00 and $7.00 levels. Sustained buying pressure and positive market sentiment could push the price towards the upper Fibonacci levels.
𝗕𝗲𝗮𝗿𝗶𝘀𝗵 𝗦𝗰𝗲𝗻𝗮𝗿𝗶𝗼 📉
If the price fails to break above the 200 EMA and descends below the support at $4.428, it could test lower support levels around $3.50 and $3.00. Continued bearish sentiment and negative news could drive the price lower.
𝗖𝗼𝗻𝗰𝗹𝘂𝘀𝗶𝗼𝗻 📊
While the #NEAR USDT chart shows mixed signals, the bullish divergence and recent "Buy" signal provide a positive outlook. A confiRRMED breakout above the 200 EMA and the descending trendline would solidify the bullish case, targeting higher resistance levels.
Disclaimer
The information and publications are not meant to be, and do not constitute, financial, investment, trading, or other types of advice or recommendations supplied or endorsed by TradingView. Read more in the Terms of Use.
Disclaimer
The information and publications are not meant to be, and do not constitute, financial, investment, trading, or other types of advice or recommendations supplied or endorsed by TradingView. Read more in the Terms of Use.