https://tradingview.sweetlogin.com/x/1RqVdqXl/
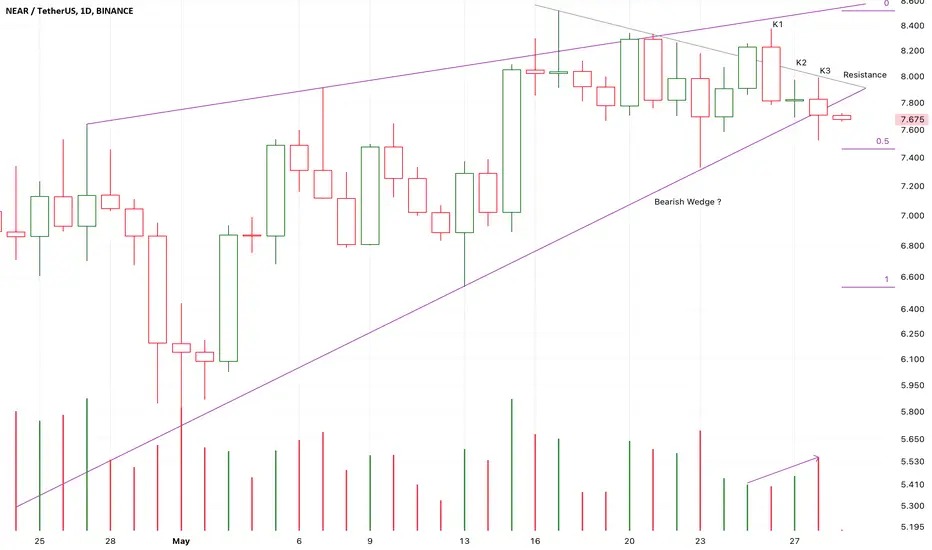
K3 close below the line of the wedge under increasing volume,
A bearish wedge had been established.
It seems that a shot-term downtrend had started earlier.
It is a potential good place to short it here.
I don't think this short-term downtrend will go far or even reverse the month scale bull market.
It is just a potential Wave(C) of a month scale consolidation.
If the following candles stay upon the o.5fib line or even close upon K3,
It will likely reverse the short-term downtrend.
Short-7.8/Stop-7.9/Target-6.0
Note
K2 slightly close below the neck line under low volume,
It is a boring short-term downtrend.
The market can’t drop deep if it keeps at such low volume.
The possibility of the following candles price up to test the 0.5fib line increased.
If K2 still stay below the neck line under increased volume,
It will much more likely keep dropping to test 6.0USDT area.
Note
K2 and k1 both close below the neck line,
And the volume of K2 slightly increased,
These are signals that verified the short-term downtrend market.
A nearest potential strong support is about 6.0 USD at 0.5 Fib line.
Trade closed: stop reached
Disclaimer
The information and publications are not meant to be, and do not constitute, financial, investment, trading, or other types of advice or recommendations supplied or endorsed by TradingView. Read more in the Terms of Use.
Disclaimer
The information and publications are not meant to be, and do not constitute, financial, investment, trading, or other types of advice or recommendations supplied or endorsed by TradingView. Read more in the Terms of Use.