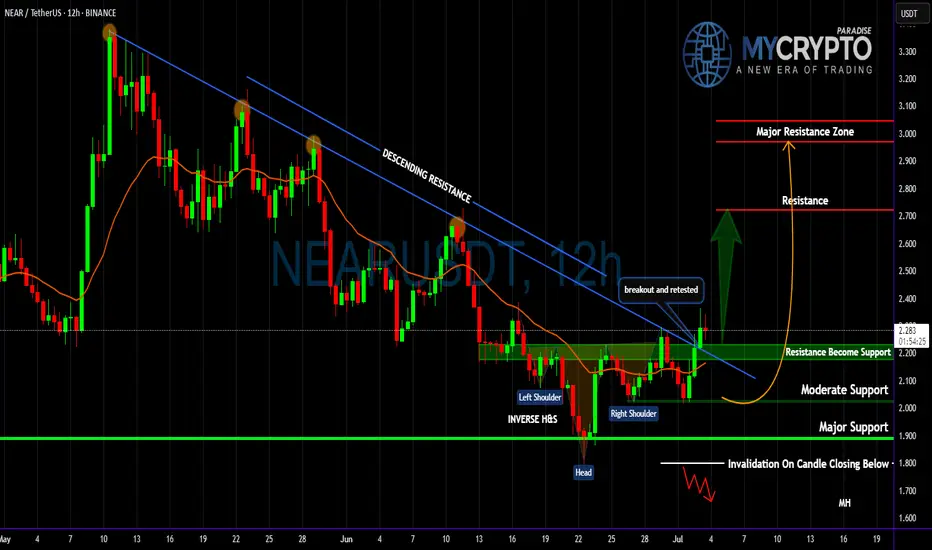
Yello Paradisers! Did you see that breakout on #NEARUSDT? After weeks of consistent lower highs and a clearly defined descending resistance, price action has finally snapped that bearish structure and completed a textbook inverse Head and Shoulders formation on the 12H chart. This kind of pattern doesn’t appear often at key cycle points, and when it does—especially with confirmation—it becomes a high-probability signal of a trend reversal.
💎#NEARUSDT ,The neckline of the inverse H&S, sitting around the $2.17–$2.23 zone, has now been broken and crucially retested as support. This means the former resistance is now acting as a probable base for bulls, and if price remains above this area, the market is likely preparing for a strong probable impulsive move to the upside.
💎The structure shows clear bullish intent, and from a technical perspective, the first resistance comes in at $2.72. A clean break above that could open the door toward the major resistance zone between $2.97 and $3.05, which would complete the projected breakout target of the H&S pattern.
💎If bulls manage to maintain control above the $2.17–$2.23 support zone, we expect price to slowly build momentum toward $2.72, with increased volatility likely once that level is tested. Should that break occur with volume, the next leg may extend rapidly into the major resistance zone. However, if price fails to hold above this flipped support zone, we will be closely watching the $2.02–$1.89 area as the last major support before invalidation.
💎A daily candle closing below $1.798 would invalidate this entire bullish thesis and put the market back into a neutral-to-bearish range.
💎Adding more probability to this setup, NEAR is now trading above multi-timeframe EMA on higher time frame. This multi-timeframe EMA alignment supports bullish continuation, as momentum begins to shift in favor of buyers. However, continuation depends heavily on how price reacts at each resistance level—especially as we enter the mid-$2.70s.
💎The probable move from here is bullish, with the expectation that NEAR pushes toward the $2.72 level in the short term, followed by a potential rally to $2.97–$3.05 if momentum sustains. This scenario remains valid as long as price holds above $2.17, and especially above $2.02. Below that, the structure weakens. Below $1.798, the bullish bias becomes fully invalidated.
This is the only way you will make it far in your crypto trading journey. Stay sharp and patient, Paradisers. It’s not about chasing pumps—it’s about positioning smartly before the crowd.
MyCryptoParadise
iFeel the success🌴
Trade closed manually
Boom! #NEARUSDT did what just we anticipated, clear precise move upside for about 26.33%Want to trade like a PRO without the 15+ year learning curve?
🫳Steal the edge - follow seasoned team of traders at mycryptoparadise.com (FREE)
✅🎖️Or go full throttle with PRO strategy + killer entry/exit signals - t.me/MCPsupportbot
🫳Steal the edge - follow seasoned team of traders at mycryptoparadise.com (FREE)
✅🎖️Or go full throttle with PRO strategy + killer entry/exit signals - t.me/MCPsupportbot
Disclaimer
The information and publications are not meant to be, and do not constitute, financial, investment, trading, or other types of advice or recommendations supplied or endorsed by TradingView. Read more in the Terms of Use.
Want to trade like a PRO without the 15+ year learning curve?
🫳Steal the edge - follow seasoned team of traders at mycryptoparadise.com (FREE)
✅🎖️Or go full throttle with PRO strategy + killer entry/exit signals - t.me/MCPsupportbot
🫳Steal the edge - follow seasoned team of traders at mycryptoparadise.com (FREE)
✅🎖️Or go full throttle with PRO strategy + killer entry/exit signals - t.me/MCPsupportbot
Disclaimer
The information and publications are not meant to be, and do not constitute, financial, investment, trading, or other types of advice or recommendations supplied or endorsed by TradingView. Read more in the Terms of Use.