NEDA Egypt should target 3.65 then 4.25
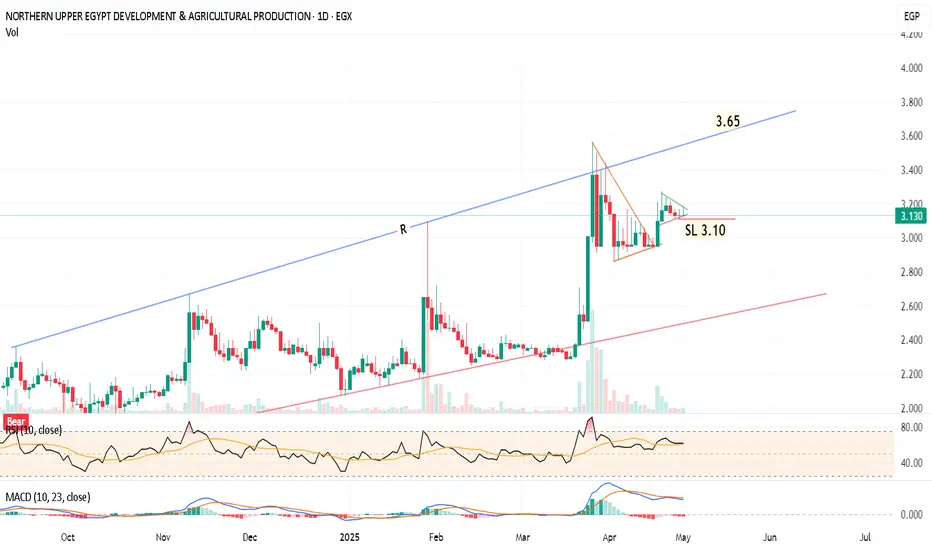
Daily chart,
the stock NEDA formed a pennant chart pattern and is forming another smaller pattern.
I am expecting some minor correction and consolidation around 3.10
Then, a bullish movement towards the resistance line R, at around 3.64 - 3.67
Stabilizing for 2 days above 3.70, will push the price to the next target 4.25
Note the resistance levels at 3.27, 3.44 , 3.56
(Closing below 3.10 for 2 days should be considered a near stop loss level)
the stock
I am expecting some minor correction and consolidation around 3.10
Then, a bullish movement towards the resistance line R, at around 3.64 - 3.67
Stabilizing for 2 days above 3.70, will push the price to the next target 4.25
Note the resistance levels at 3.27, 3.44 , 3.56
(Closing below 3.10 for 2 days should be considered a near stop loss level)
Disclaimer
The information and publications are not meant to be, and do not constitute, financial, investment, trading, or other types of advice or recommendations supplied or endorsed by TradingView. Read more in the Terms of Use.
Disclaimer
The information and publications are not meant to be, and do not constitute, financial, investment, trading, or other types of advice or recommendations supplied or endorsed by TradingView. Read more in the Terms of Use.