🔍 Price Structure & Pattern Formation
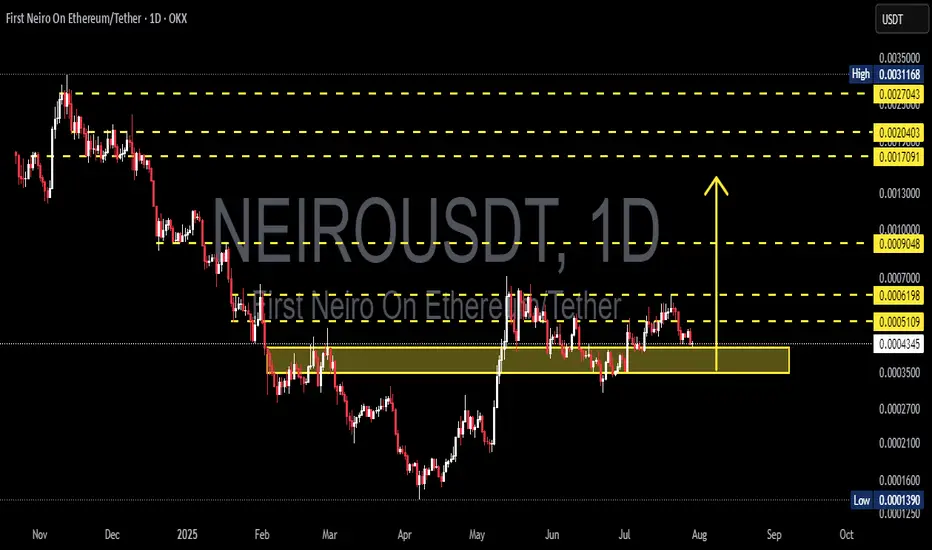
On the daily chart, NEIROUSDT is currently testing a major demand zone (highlighted in yellow) between 0.0004337 – 0.0003500 USDT. This area previously acted as a strong accumulation zone back in May and is now being retested as key support.
Price has entered a consolidation range after a short-term rally from April to May 2025.
Strong Support: 0.0004337 – 0.0003500
Nearest Resistance Levels: 0.0005109, 0.0006198
---
📈 Bullish Scenario
If the price holds above the demand zone and forms a valid bullish reversal pattern (e.g., bullish engulfing, pin bar), then a bullish move could follow.
Upside Targets (Resistance Levels):
1. 0.0005109
2. 0.0006198
3. 0.0009048
4. 0.0017091 (extended target)
5. 0.0020403
6. 0.0027043 (mid/long-term target)
Bullish Confirmation:
Daily close above 0.0006198
Increasing volume on bounce
Bullish candlestick formation in demand zone
---
📉 Bearish Scenario
If the price breaks below 0.0004337 and closes the day under it, it would indicate further downside potential.
Downside Targets (Support Levels):
1. 0.0003500 (bottom of demand zone)
2. 0.0002700
3. 0.0001600
4. 0.0001390 (previous major low)
Bearish Confirmation:
Strong daily close below 0.0004337
Retest of the zone fails as resistance
Bearish volume spikes
---
📐 Price Patterns
Potential Double Bottom: A bounce from this zone may form a double bottom pattern, with the neckline near 0.0006198.
Sideways Range / Accumulation: Price action since June indicates potential accumulation if the support holds.
---
🔑 Conclusion
NEIROUSDT is at a critical juncture — waiting for confirmation whether it will bounce from this strong demand zone or break down to continue the bearish trend. Key resistance and support levels are well-defined, providing clear strategies for breakout or rebound traders.
---
📌 Trading Suggestions
Aggressive Longs: Look for bullish signals inside the demand zone (0.00043 – 0.00035)
Conservative Longs: Wait for a breakout above 0.0006198 for trend reversal confirmation
Shorts: Enter if there's a confirmed breakdown below 0.0004337
#NEIROUSDT #CryptoAnalysis #TradingView #AltcoinWatch #SupportResistance #TechnicalAnalysis #BullishSetup #BearishScenario #CryptoTA #ChartUpdate #PriceAction
✅ Get Free Signals! Join Our Telegram Channel Here: t.me/TheCryptoNuclear
✅ Twitter: twitter.com/crypto_nuclear
✅ Join Bybit : partner.bybit.com/b/nuclearvip
✅ Benefits : Lifetime Trading Fee Discount -50%
✅ Twitter: twitter.com/crypto_nuclear
✅ Join Bybit : partner.bybit.com/b/nuclearvip
✅ Benefits : Lifetime Trading Fee Discount -50%
Disclaimer
The information and publications are not meant to be, and do not constitute, financial, investment, trading, or other types of advice or recommendations supplied or endorsed by TradingView. Read more in the Terms of Use.