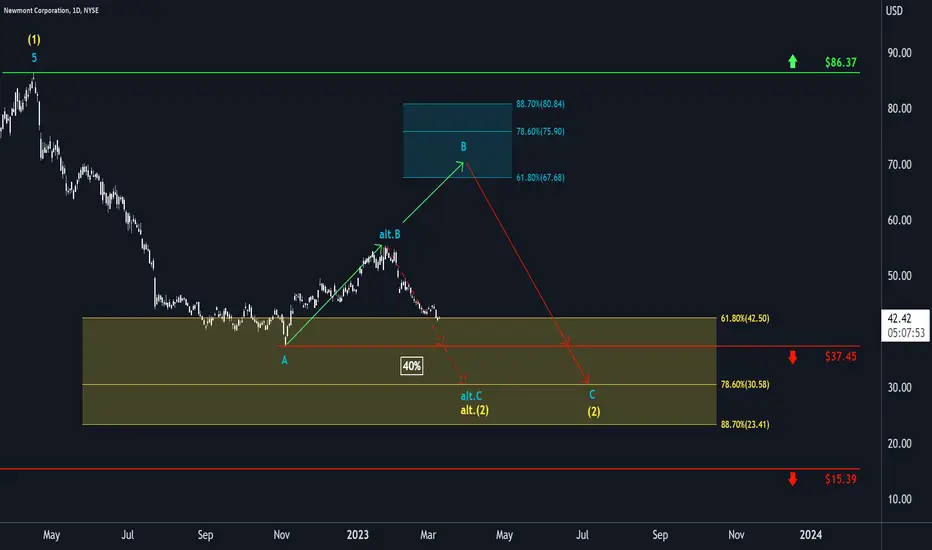
Newmont is flirting quite heavily with our alternative scenario, moving closer and closer to the support at $37.45. By now, it is touching the upper edge of the yellow zone between $42.50 and $23.41, on the verge of slumping deeper. There is a 40% chance that the course might do so, dropping below the support at $37.45 to develop wave alt.(2) in yellow earlier already. However, primarily, we still expect Newmont to turn upwards first to head for the turquoise zone between $67.68 and $80.84. There, the share should place the top of wave B in turquoise before starting a fresh downwards movement, which should then lead into the yellow zone and thus below $37.45. Beneath this mark, Newmont should complete the overarching descent in the form of wave (2) in yellow.
📊 Free daily market insights combining macro + Elliott Wave analysis
🚀 Spot trends early with momentum, sentiment & price structure
🌐 Join thousands trading smarter - full free analyses at dailymarketupdate.com
🚀 Spot trends early with momentum, sentiment & price structure
🌐 Join thousands trading smarter - full free analyses at dailymarketupdate.com
Related publications
Disclaimer
The information and publications are not meant to be, and do not constitute, financial, investment, trading, or other types of advice or recommendations supplied or endorsed by TradingView. Read more in the Terms of Use.