Here’s why we can see a small correction in NEO/USD.
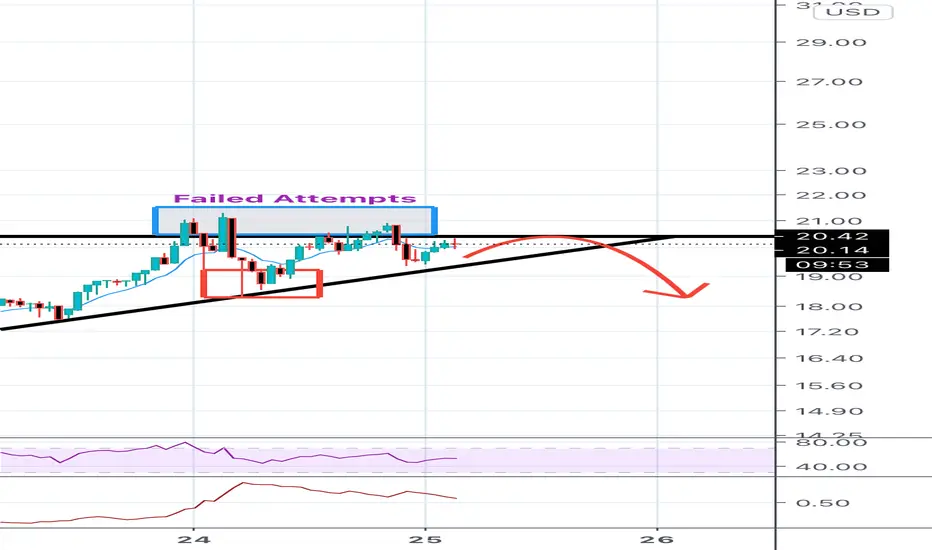
We can see the horizontal resistance at 20.42. This is a key resistance on the 4H and 1D time frame.
We can see multiple failed attempts of conquering this resistance (blue box)
Using patterns as reference, we can see a rising wedge coming to completing which usually ends with a break in trend support.
If we do break support, we can expect to see 18.30 area (red box) as it would act as next horizontal support.
Please like, share and follow this idea. Your support means everything <3
Disclaimer
The information and publications are not meant to be, and do not constitute, financial, investment, trading, or other types of advice or recommendations supplied or endorsed by TradingView. Read more in the Terms of Use.
Disclaimer
The information and publications are not meant to be, and do not constitute, financial, investment, trading, or other types of advice or recommendations supplied or endorsed by TradingView. Read more in the Terms of Use.