This idea is only for my educational purposes! New to trading, criticism is highly appreciated.
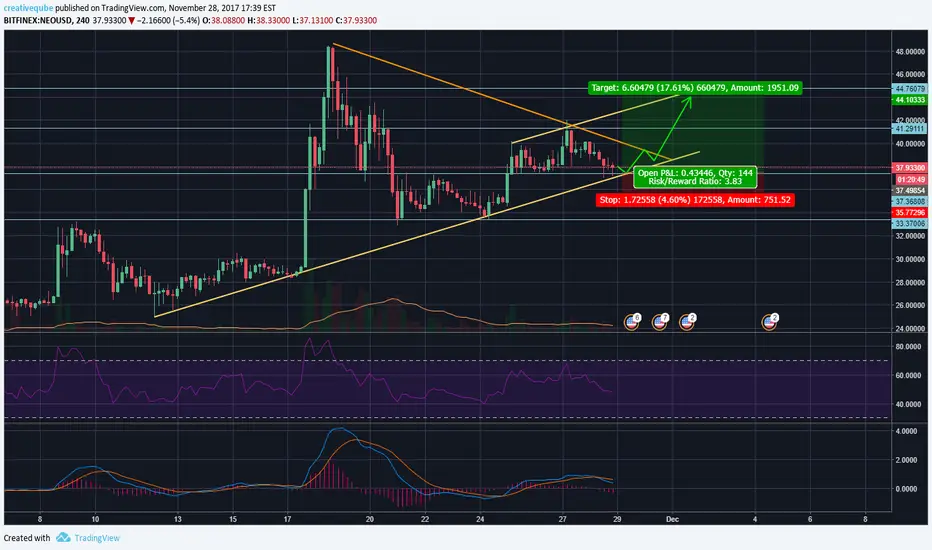
As we can see from the graph, there is obviously a symmetrical triangle. Volume is declining, which alerts us that it might be a breakout.
The breakout will probably bring us back closer to 50. Possible sell at 44 level.
RSI should show us that market is bullish soon.
P.S.
Please comment if you have any opinion on my chart.
Disclaimer
The information and publications are not meant to be, and do not constitute, financial, investment, trading, or other types of advice or recommendations supplied or endorsed by TradingView. Read more in the Terms of Use.
Disclaimer
The information and publications are not meant to be, and do not constitute, financial, investment, trading, or other types of advice or recommendations supplied or endorsed by TradingView. Read more in the Terms of Use.
