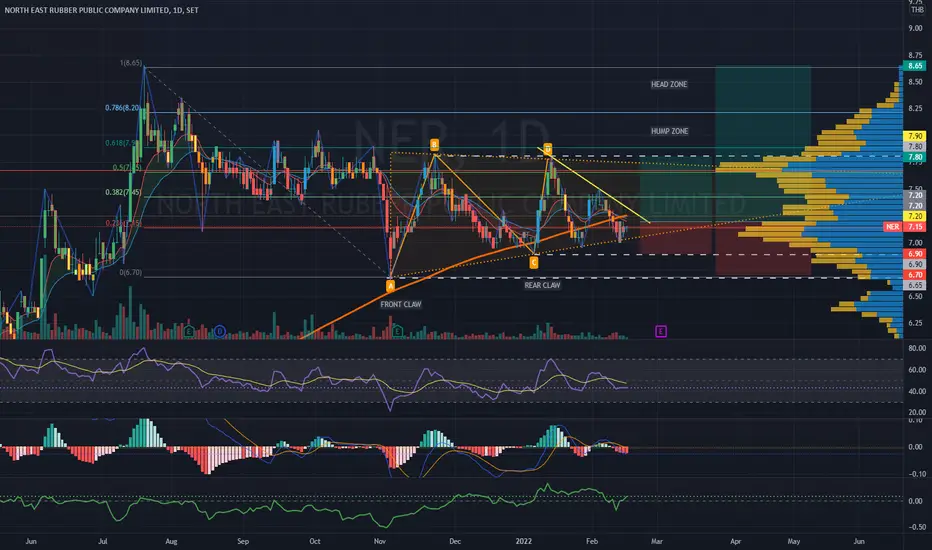
Price Action and chart pattern short-medium term trading
> Rising Triangle Dragon Pattern
> Entry @ breakout trend line SMA 200
Indicator:
> Bullish RSI crossing MA line above 50
> Rising MACD just below baseline
> CMF reversal crossed baseline 0.
Short term RR 2:1 Medium-term RR 3:1
Always respect your stoploss
> Rising Triangle Dragon Pattern
> Entry @ breakout trend line SMA 200
Indicator:
> Bullish RSI crossing MA line above 50
> Rising MACD just below baseline
> CMF reversal crossed baseline 0.
Short term RR 2:1 Medium-term RR 3:1
Always respect your stoploss
Disclaimer
The information and publications are not meant to be, and do not constitute, financial, investment, trading, or other types of advice or recommendations supplied or endorsed by TradingView. Read more in the Terms of Use.
Disclaimer
The information and publications are not meant to be, and do not constitute, financial, investment, trading, or other types of advice or recommendations supplied or endorsed by TradingView. Read more in the Terms of Use.