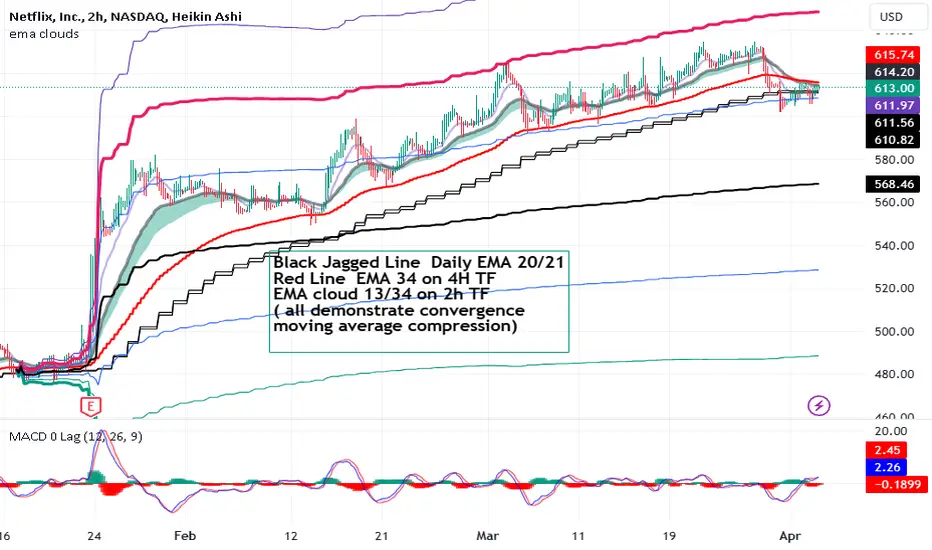
NFLX has added 20% to price in the two months since the last earnings which were decent
but not remarkable. The 2H chart shows a dip of about $20 per share coincident with a fall
from the second upper VWAP line to support from the first upper VWAP line. The zero lag
MACD shows line rising over the horizontal zero level in perhaps a sign of bullish divergence.
The lines are now over the low amplitude histogram. I will take a long trade here targeting
$650. Recent news is the CEO sold 20,000 shares out of the 12,000,000 that he has control
of. Nothing unusual there. His friends and others ( myself included) may be buying the dip.
Trade active
Decent action today- looking for more after NT lunch hour. Stop loss raised but stillbelow break even. Took a partial profit and added back on a small momentum fade.
Note
Price moving after the NY lunch hour ended Note
Price moved up a little today. Patiently holding.Note
Partial profit taken at price of 638 now adding back on the dip to 617.Disclaimer
The information and publications are not meant to be, and do not constitute, financial, investment, trading, or other types of advice or recommendations supplied or endorsed by TradingView. Read more in the Terms of Use.
Disclaimer
The information and publications are not meant to be, and do not constitute, financial, investment, trading, or other types of advice or recommendations supplied or endorsed by TradingView. Read more in the Terms of Use.