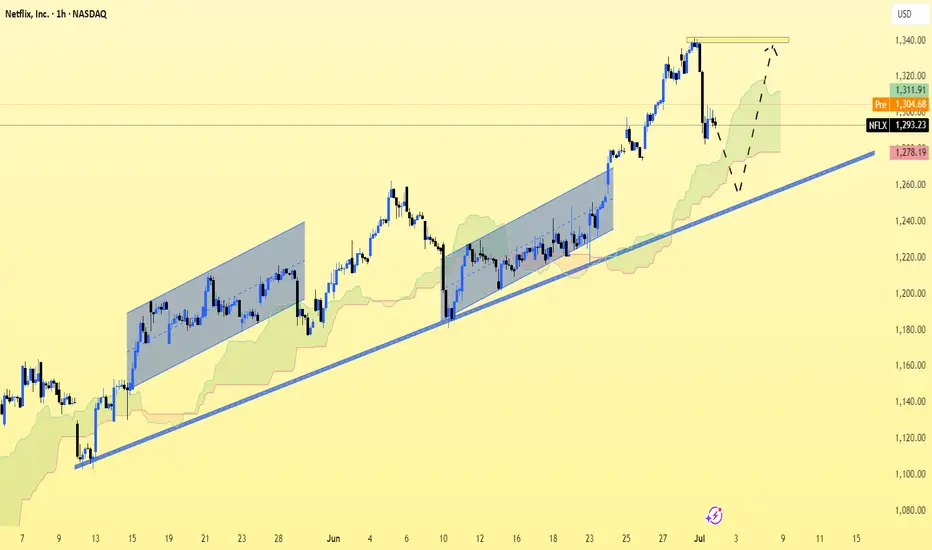
NFLX (Netflix Inc.) on the 1-hour chart (NASDAQ) using price action, trendlines, and Ichimoku Cloud.
Observations:
There's a strong uptrend with higher highs and higher lows.
Price recently pulled back and is currently testing the Ichimoku cloud support, possibly forming a bullish continuation pattern.
A trendline from June is acting as dynamic support.
I have a yellow resistance zone drawn at the top, signaling the next potential bullish target.
---
🎯 Target (Short-Term):
Primary Target Zone: $1,335 – $1,340
(This is the previous swing high and resistance area you've marked.)
Secondary Target (if breakout succeeds): $1,350+
---
🛑 Suggested Stop Loss:
Below $1,270, or below the trendline/Ichimoku cloud for safer risk management.
---
📝 Summary:
Bias: Bullish continuation.
Buy zone: Near current price (~$1,290–$1,295) or on confirmation candle.
Target: $1,335–$1,340
Invalidation: Break and close below $1,270 trendline.
Let me know if you'd like a breakdown for a swing or intraday trade.
Trade active
active📲 Join telegram channel free ..
t.me/EU_USA_AND_CHAINA_TRADER
Forex, Gold & Crypto Signals with detailed analysis & get consistent results..
Gold Signal's with proper TP & SL for high profit ..
t.me/Gold_Analysis_Experiment
t.me/EU_USA_AND_CHAINA_TRADER
Forex, Gold & Crypto Signals with detailed analysis & get consistent results..
Gold Signal's with proper TP & SL for high profit ..
t.me/Gold_Analysis_Experiment
Related publications
Disclaimer
The information and publications are not meant to be, and do not constitute, financial, investment, trading, or other types of advice or recommendations supplied or endorsed by TradingView. Read more in the Terms of Use.
📲 Join telegram channel free ..
t.me/EU_USA_AND_CHAINA_TRADER
Forex, Gold & Crypto Signals with detailed analysis & get consistent results..
Gold Signal's with proper TP & SL for high profit ..
t.me/Gold_Analysis_Experiment
t.me/EU_USA_AND_CHAINA_TRADER
Forex, Gold & Crypto Signals with detailed analysis & get consistent results..
Gold Signal's with proper TP & SL for high profit ..
t.me/Gold_Analysis_Experiment
Related publications
Disclaimer
The information and publications are not meant to be, and do not constitute, financial, investment, trading, or other types of advice or recommendations supplied or endorsed by TradingView. Read more in the Terms of Use.