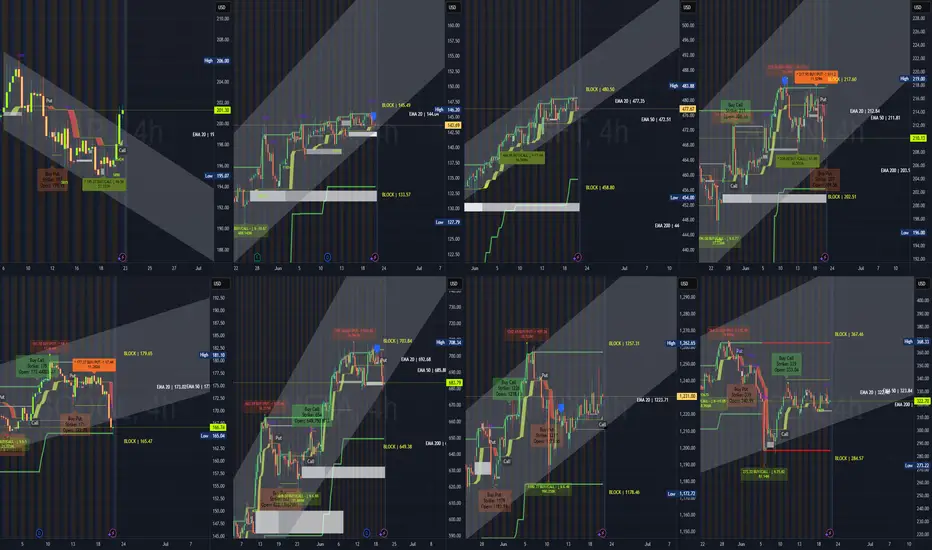
Institutional Swing Analysis – Jun 21, 2025
📈 AAPL
Trend: Reversal attempt in downtrend
Buy Zones (CALLs): 196 (accumulation)
Sell Zones (PUTs): 199 (distribution)
Support Block: —
Resistance: 201 → 204 → 206
Scenario: Above 200 = continuation to 204–206. Below 198 = back to 195–194.
📈 NVDA
Trend: Consolidating at resistance
Buy Zones: 142.5
Gap Support: 133.57 → 130.27
Support Block: 133.57
Resistance Block: 145.60
Scenario: Above 145.6 = breakout. Below 133.5 = gap fill toward 130.
📈 MSFT
Trend: Strong uptrend
Buy Zones: 466 (accumulation)
Gap Support: 458.8 → 450
Support Block: 458.80
Resistance Block: 480.50
Scenario: Holds 470 = test 485+. Below 458 = fill gap to 450.
📈 AMZN
Trend: Sideways in a wide range
Buy Zones: 212 (accumulation)
Sell Zones: 204, 200
Gap Support: 202.5 → 198
Support Block: 202.51
Resistance Block: 217.60
Scenario: Holding 210 = move to 217+. Below 202 = fill gap to 198–195.
📈 GOOGL
Trend: Bearish
Buy Zones: 175
Sell Zones: 172
Gap Support: 166.7 → 165.4
Support Block: 165.47
Resistance Block: 179.65
Scenario: Below 172 = gap test. Under 165 = risk to 160. Above 179.6 = reversal begins.
📈 META
Trend: Bullish but retracing
Buy Zones: 684
Sell Zones: 708
Gap Support: 683.8 → 649
Support Block: 649.38
Resistance Block: 703.84
Scenario: Holding 683 = move to 700+. Below 683 = gap fill to 649.
📈 NFLX
Trend: Sideways
Buy Zones: 1224
Sell Zones: 1178, 1200
Support Block: 1178.46
Resistance Block: 1257.31
Scenario: Over 1257 = breakout. Below 1220 = retest 1190.
📈 TSLA
Trend: Compressing sideways
Buy Zones: 313 (accumulation)
Sell Zones: 336, 319
Support Block: 284.57
Resistance Block: 367.46
Scenario: Above 336 = move to 355. Below 313 = test 300 → 284.
Disclaimer
The information and publications are not meant to be, and do not constitute, financial, investment, trading, or other types of advice or recommendations supplied or endorsed by TradingView. Read more in the Terms of Use.
Disclaimer
The information and publications are not meant to be, and do not constitute, financial, investment, trading, or other types of advice or recommendations supplied or endorsed by TradingView. Read more in the Terms of Use.