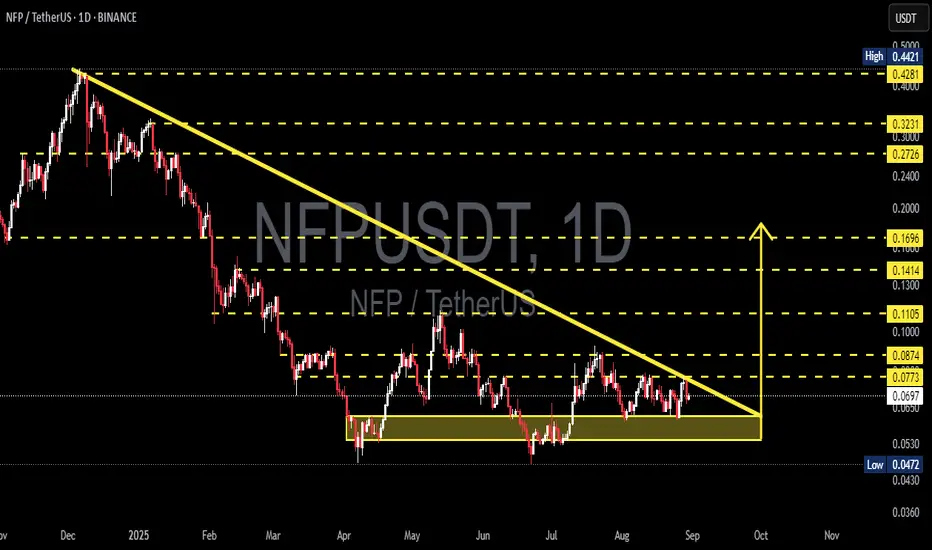
The pair NFP/USDT is currently at a critical juncture. The chart shows a clear Descending Triangle pattern: a series of lower highs (seller pressure) aligned with a falling trendline, while a strong horizontal support zone around 0.047 – 0.062 continues to hold as buyers defend it.
Typically, this formation suggests a bearish continuation, but as the price approaches the triangle’s apex, the probability of a bullish breakout also rises if supported by strong volume. In other words, NFP is now in a “do or die” position — preparing for its next major move.
---
🔎 Technical Structure & Key Levels
Main Pattern: Descending Triangle → generally bearish bias, but breakout upside is possible.
Current Price: ~ 0.0697, very close to the apex, signaling an upcoming strong move.
Strong Support Zone: 0.047 – 0.062 (demand area repeatedly tested).
Key Resistance near trendline: 0.077 – 0.087 (bullish breakout confirmation zone).
Next Resistances: 0.1105, 0.1414, 0.1696, then 0.2726 – 0.3231, and 0.4421 (major historical resistance).
---
📈 Bullish Scenario — Breakout Potential
If NFP breaks above the descending trendline and closes a daily candle above 0.077 – 0.087 with strong volume, a medium-term reversal could be underway.
🎯 Short-term target: 0.1105
🎯 Next targets: 0.1414 – 0.1696
🎯 Extended targets: 0.2726 – 0.3231, up to 0.4421 if momentum sustains
🔑 Additional confirmation: successful retest of the breakout zone, proving buyer strength.
---
📉 Bearish Scenario — Breakdown Continuation
If price breaks below the strong support 0.0472, the descending triangle confirms as a bearish continuation pattern.
🎯 First target: 0.036 – 0.030 (next historical support zone).
🎯 Deeper targets possible if selling pressure accelerates.
🔑 Additional confirmation: failed retest of the broken support, turning into resistance.
---
⚖️ Key Takeaways
NFP/USDT is at a decision point. The descending triangle is tightening and a big move is near.
Bias: Slightly bearish due to the pattern, but bullish reversal remains possible with a breakout above 0.087 and strong volume.
Conservative traders: Wait for confirmation before entry. False breakouts/breakdowns are common without volume.
Risk management is crucial: set stop-loss below the support zone for longs, or above breakout levels for shorts.
---
As price approaches the apex of the triangle, volatility usually spikes. That means a decisive move is coming soon — either a breakout rally or a bearish continuation. For now, NFP/USDT is a must-watch: will buyers flip the script, or will sellers win the battle?
#NFP #NFPUSDT #Crypto #TechnicalAnalysis #DescendingTriangle #SupportResistance #Breakout #BearishOrBullish #CryptoTrading
✅ Get Free Signals! Join Our Telegram Channel Here: t.me/TheCryptoNuclear
✅ Twitter: twitter.com/crypto_nuclear
✅ Join Bybit : partner.bybit.com/b/nuclearvip
✅ Benefits : Lifetime Trading Fee Discount -50%
✅ Twitter: twitter.com/crypto_nuclear
✅ Join Bybit : partner.bybit.com/b/nuclearvip
✅ Benefits : Lifetime Trading Fee Discount -50%
Disclaimer
The information and publications are not meant to be, and do not constitute, financial, investment, trading, or other types of advice or recommendations supplied or endorsed by TradingView. Read more in the Terms of Use.