Use this as a guide to develop your personal view of the chart.
Main items we observe on the Daily Timeframe:
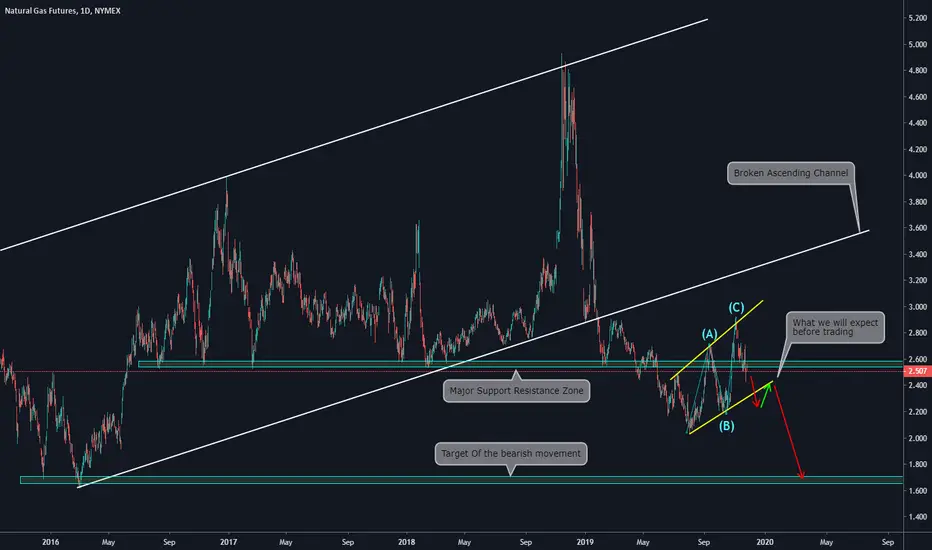
a)Price Broke the ascending channel and the major Support/Resistance zone
b)Currently, the price is inside a Flag pattern on an ABC pattern with a clear structure (yellow lines)
c)These types of patterns are considered continuation structures (meaning that, from a technical perspective, when these structures are broken the price should continue on the same direction of the previous motive wave)
d)IF the price brakes below the lower trendline of the corrective structure we will look for a pull-back on a lower timeframe such as 4hs/1h and we will set our short orders (Entry below the 4h/1h structure, stop above it, and take profit on the lower support zone visible on the chart)
e)It is really important to have patience and wait for a proper confirmation before setting orders, your worst scenario should be NOT ENTERING THE MARKET.
Weekly Vision:

Main items we observe on the Daily Timeframe:
a)Price Broke the ascending channel and the major Support/Resistance zone
b)Currently, the price is inside a Flag pattern on an ABC pattern with a clear structure (yellow lines)
c)These types of patterns are considered continuation structures (meaning that, from a technical perspective, when these structures are broken the price should continue on the same direction of the previous motive wave)
d)IF the price brakes below the lower trendline of the corrective structure we will look for a pull-back on a lower timeframe such as 4hs/1h and we will set our short orders (Entry below the 4h/1h structure, stop above it, and take profit on the lower support zone visible on the chart)
e)It is really important to have patience and wait for a proper confirmation before setting orders, your worst scenario should be NOT ENTERING THE MARKET.
Weekly Vision:
Disclaimer
The information and publications are not meant to be, and do not constitute, financial, investment, trading, or other types of advice or recommendations supplied or endorsed by TradingView. Read more in the Terms of Use.
Disclaimer
The information and publications are not meant to be, and do not constitute, financial, investment, trading, or other types of advice or recommendations supplied or endorsed by TradingView. Read more in the Terms of Use.