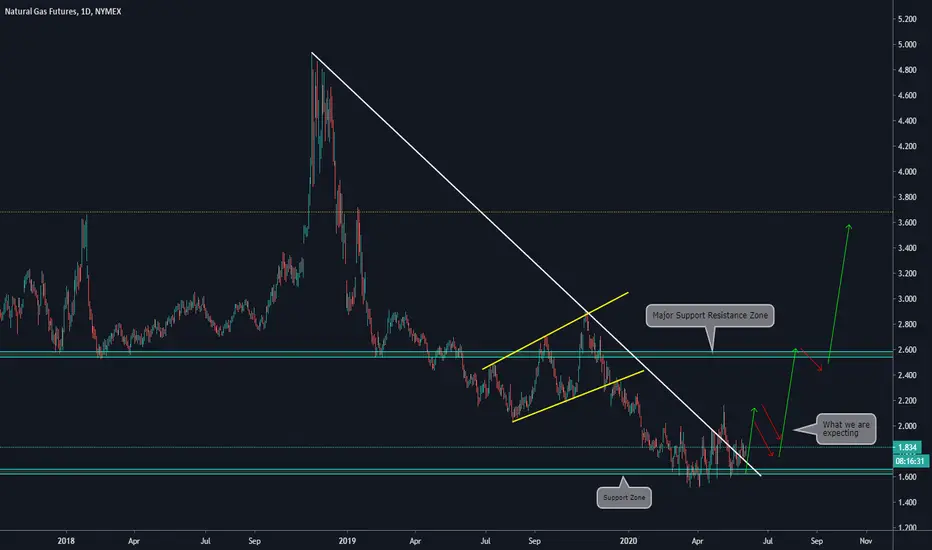
Main items we can see on the chart:
a) The price is on a well-tested support zone
b) The price has broken the descending trendline
c) We want to see a clear impulse outside the previous descending trendline + a 10-12 days correction
d) The reason we have decided that filter is because we observed similar behavior on the Weekly Chart in previous situations
WEEKLY CHART:
Related publications
Disclaimer
The information and publications are not meant to be, and do not constitute, financial, investment, trading, or other types of advice or recommendations supplied or endorsed by TradingView. Read more in the Terms of Use.
Related publications
Disclaimer
The information and publications are not meant to be, and do not constitute, financial, investment, trading, or other types of advice or recommendations supplied or endorsed by TradingView. Read more in the Terms of Use.