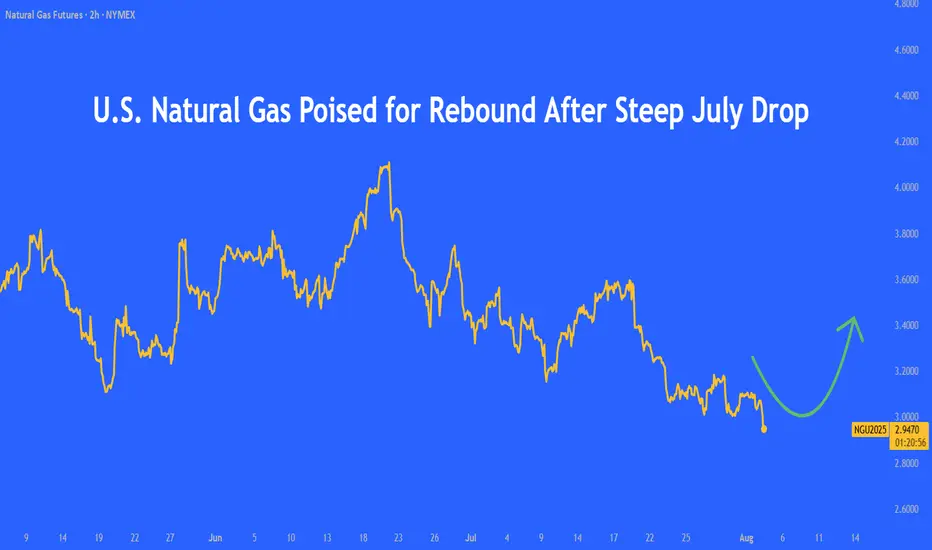
U.S. natural gas prices sank in July due to mild weather, strong supply, and LNG export disruptions. The EIA cut its price outlook but expects a recovery by winter.
While technicals hint at a short-term rebound, oversupply and weak summer demand keep pressure on prices. A sustained recovery depends on tighter balances and rising LNG flows.
MILD WEATHER AND STRONG SUPPLY DRAGGED U.S. NAT-GAS PRICES
CME Henry Hub Natural Gas Futures fell 10.1% in July, marking the steepest monthly decline since April (-19.3%). For the week ending 25/Jul, prices dropped 12.8%, marking the sharpest weekly fall since the week ending 31/Jan (-24.4%).

The selloff was fuelled by milder-than-expected summer weather, robust production, reduced LNG exports, and strong storage builds. July typically sees lower U.S. gas demand compared to the winter months, and in 2025, cooler conditions curbed electricity use for air conditioning, softening demand for gas-fired power generation.
Meanwhile, U.S. natural gas output remained robust through H1 2025, with supply growth outpacing consumption.
With production still high and power sector demand underwhelming, the EIA expects prices to remain under pressure until the winter withdrawal season (November to March).
LNG EXPORT DISRUPTIONS DEEPEN PRESSURE ON U.S. GAS PRICES AMID STRONG SUPPLY
U.S. LNG export flows declined in July 2025, primarily due to maintenance and operational delays at major terminals. These disruptions significantly reduced gas deliveries to export facilities, limiting outbound volumes despite the U.S. maintaining ample export capacity.
At the same time, domestic natural gas supply continued to rise. According to S&P Global, for the week ending 30/Jul, total supply increased by 0.2% week-over-week. While modest, this supply growth added to an already well-supplied market.
The reduced export activity amplified the bearish impact of weak summer demand, contributing to the sharp price decline seen in July.
RISING U.S. GAS INVENTORIES ADD PRESSURE AS PRODUCTION OUTPACES DEMAND
Another drag on prices has been the steady build-up in U.S. natural gas inventories in recent weeks, driven largely by increased domestic production.

Source: EIA
As of the week ending 25/Jul, U.S. natural gas inventories are 6.7% above the five-year average (2020–2024) despite ending the previous withdrawal season 4% below the five-year average, the lowest in three years.

Source: EIA
Injections have exceeded the five-year average as U.S. natural gas production has increased in Q2 2025 compared with Q1 2025.
The EIA expects inventories to end the injection season on 31/Oct with 3,910 Bcf of natural gas in storage, 5% more than the forecast it made previously and 3% more than the five-year average.
EIA LOWERS GAS OUTLOOK BUT STILL EXPECTS A REBOUND IN PRICES
The EIA has revised its natural gas price outlook downward in its latest Short-Term Energy Outlook (STEO), citing stronger-than-expected storage builds. The agency now forecasts Henry Hub prices to average USD 3.67/MMBtu in 2024 (down 8.7%) and USD 4.41/MMBtu in 2025 (down 9.6%) compared to the previous month’s estimates.

Source: EIA STEO
Despite the lower near-term outlook, the EIA still sees prices gradually rising from Q3 2025 through Q1 2026. As maintenance at major LNG export facilities concludes, export volumes are expected to recover, helping to absorb excess supply.
Additionally, structural demand from Europe remains strong. The EU has committed to purchasing USD 750 billion worth of energy—including LNG, crude oil, and nuclear fuels- from the U.S. over the next three years.
BEARISH PRESSURE PERSISTS, BUT TECHNICAL INDICATORS HINT AT REBOUND
Henry Hub has traded below its 9-day and 21-day moving averages since 21/Jul, signalling sustained bearish pressure.

On 01/Aug, it showed signs of breaking above the 9-day average, hinting at a potential shift.

RSI and MACD indicators are suggesting fading bearish momentum for Henry Hub, pointing to a potential short-term price rebound.
HYPOTHETICAL TRADE SETUP
Henry Hub prices saw a steep monthly drop in July, weighed down by multiple factors mentioned above. However, several signs point to a potential rebound.
Despite the recent slide, technical indicators like RSI and MACD suggest fading bearish momentum.
With bearish drivers priced in and both technical and fundamental signals hinting at stabilization or a short-term bounce, traders may consider going long CME Micro Henry Hub Natural Gas Futures.
These contracts, sized at 1/10th of the standard futures, offer efficient capital deployment and precise risk control, making them ideal for expressing directional views or scaling into a larger position as confirmation builds.

This paper posits a long position in CME Micro Henry Hub Natural Gas Futures (Sep 2025) expiring on 26/Aug (MNGU2025) with the following trade setup:
• Entry: 3.10/MMBtu
• Target: 3.46/barrel
• Stop: 2.86/barrel
• P&L at Target (per lot): +360 ((3.46 – 3.10) x 1,000)
• P&L at Stop (per lot): -240 ((3.10– 2.86) x 1,000)
• Reward-to-Risk Ratio: 1.5x
The same view can be expressed using standard CME Natural Gas futures, which offer 10x larger notional sizes and deep liquidity.
MARKET DATA
CME Real-time Market Data helps identify trading set-ups and express market views better. If you have futures in your trading portfolio, you can check out on CME Group data plans available that suit your trading needs tradingview.com/cme.
DISCLAIMER
This case study is for educational purposes only and does not constitute investment recommendations or advice. Nor are they used to promote any specific products, or services.
Trading or investment ideas cited here are for illustration only, as an integral part of a case study to demonstrate the fundamental concepts in risk management or trading under the market scenarios being discussed. Please read the FULL DISCLAIMER the link to which is provided in our profile description.
While technicals hint at a short-term rebound, oversupply and weak summer demand keep pressure on prices. A sustained recovery depends on tighter balances and rising LNG flows.
MILD WEATHER AND STRONG SUPPLY DRAGGED U.S. NAT-GAS PRICES
CME Henry Hub Natural Gas Futures fell 10.1% in July, marking the steepest monthly decline since April (-19.3%). For the week ending 25/Jul, prices dropped 12.8%, marking the sharpest weekly fall since the week ending 31/Jan (-24.4%).
The selloff was fuelled by milder-than-expected summer weather, robust production, reduced LNG exports, and strong storage builds. July typically sees lower U.S. gas demand compared to the winter months, and in 2025, cooler conditions curbed electricity use for air conditioning, softening demand for gas-fired power generation.
Meanwhile, U.S. natural gas output remained robust through H1 2025, with supply growth outpacing consumption.
With production still high and power sector demand underwhelming, the EIA expects prices to remain under pressure until the winter withdrawal season (November to March).
LNG EXPORT DISRUPTIONS DEEPEN PRESSURE ON U.S. GAS PRICES AMID STRONG SUPPLY
U.S. LNG export flows declined in July 2025, primarily due to maintenance and operational delays at major terminals. These disruptions significantly reduced gas deliveries to export facilities, limiting outbound volumes despite the U.S. maintaining ample export capacity.
At the same time, domestic natural gas supply continued to rise. According to S&P Global, for the week ending 30/Jul, total supply increased by 0.2% week-over-week. While modest, this supply growth added to an already well-supplied market.
The reduced export activity amplified the bearish impact of weak summer demand, contributing to the sharp price decline seen in July.
RISING U.S. GAS INVENTORIES ADD PRESSURE AS PRODUCTION OUTPACES DEMAND
Another drag on prices has been the steady build-up in U.S. natural gas inventories in recent weeks, driven largely by increased domestic production.
Source: EIA
As of the week ending 25/Jul, U.S. natural gas inventories are 6.7% above the five-year average (2020–2024) despite ending the previous withdrawal season 4% below the five-year average, the lowest in three years.
Source: EIA
Injections have exceeded the five-year average as U.S. natural gas production has increased in Q2 2025 compared with Q1 2025.
The EIA expects inventories to end the injection season on 31/Oct with 3,910 Bcf of natural gas in storage, 5% more than the forecast it made previously and 3% more than the five-year average.
EIA LOWERS GAS OUTLOOK BUT STILL EXPECTS A REBOUND IN PRICES
The EIA has revised its natural gas price outlook downward in its latest Short-Term Energy Outlook (STEO), citing stronger-than-expected storage builds. The agency now forecasts Henry Hub prices to average USD 3.67/MMBtu in 2024 (down 8.7%) and USD 4.41/MMBtu in 2025 (down 9.6%) compared to the previous month’s estimates.
Source: EIA STEO
Despite the lower near-term outlook, the EIA still sees prices gradually rising from Q3 2025 through Q1 2026. As maintenance at major LNG export facilities concludes, export volumes are expected to recover, helping to absorb excess supply.
Additionally, structural demand from Europe remains strong. The EU has committed to purchasing USD 750 billion worth of energy—including LNG, crude oil, and nuclear fuels- from the U.S. over the next three years.
BEARISH PRESSURE PERSISTS, BUT TECHNICAL INDICATORS HINT AT REBOUND
Henry Hub has traded below its 9-day and 21-day moving averages since 21/Jul, signalling sustained bearish pressure.
On 01/Aug, it showed signs of breaking above the 9-day average, hinting at a potential shift.
RSI and MACD indicators are suggesting fading bearish momentum for Henry Hub, pointing to a potential short-term price rebound.
HYPOTHETICAL TRADE SETUP
Henry Hub prices saw a steep monthly drop in July, weighed down by multiple factors mentioned above. However, several signs point to a potential rebound.
Despite the recent slide, technical indicators like RSI and MACD suggest fading bearish momentum.
With bearish drivers priced in and both technical and fundamental signals hinting at stabilization or a short-term bounce, traders may consider going long CME Micro Henry Hub Natural Gas Futures.
These contracts, sized at 1/10th of the standard futures, offer efficient capital deployment and precise risk control, making them ideal for expressing directional views or scaling into a larger position as confirmation builds.
This paper posits a long position in CME Micro Henry Hub Natural Gas Futures (Sep 2025) expiring on 26/Aug (MNGU2025) with the following trade setup:
• Entry: 3.10/MMBtu
• Target: 3.46/barrel
• Stop: 2.86/barrel
• P&L at Target (per lot): +360 ((3.46 – 3.10) x 1,000)
• P&L at Stop (per lot): -240 ((3.10– 2.86) x 1,000)
• Reward-to-Risk Ratio: 1.5x
The same view can be expressed using standard CME Natural Gas futures, which offer 10x larger notional sizes and deep liquidity.
MARKET DATA
CME Real-time Market Data helps identify trading set-ups and express market views better. If you have futures in your trading portfolio, you can check out on CME Group data plans available that suit your trading needs tradingview.com/cme.
DISCLAIMER
This case study is for educational purposes only and does not constitute investment recommendations or advice. Nor are they used to promote any specific products, or services.
Trading or investment ideas cited here are for illustration only, as an integral part of a case study to demonstrate the fundamental concepts in risk management or trading under the market scenarios being discussed. Please read the FULL DISCLAIMER the link to which is provided in our profile description.
Full Disclaimer - linktr.ee/mintfinance
Disclaimer
The information and publications are not meant to be, and do not constitute, financial, investment, trading, or other types of advice or recommendations supplied or endorsed by TradingView. Read more in the Terms of Use.
Full Disclaimer - linktr.ee/mintfinance
Disclaimer
The information and publications are not meant to be, and do not constitute, financial, investment, trading, or other types of advice or recommendations supplied or endorsed by TradingView. Read more in the Terms of Use.