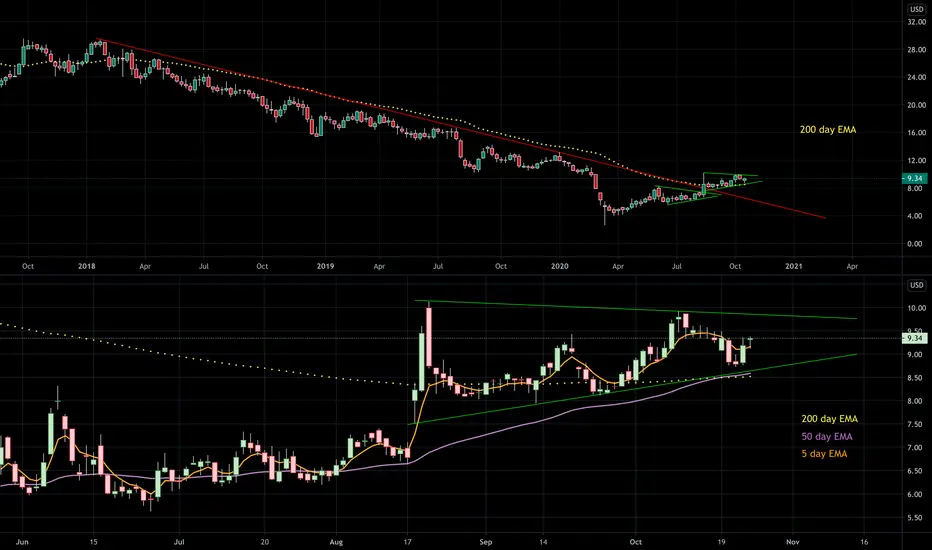
Top: Weekly candle chart of NGS
-Breakout of downtrend
-Reclaiming of 200 day* EMA and wedge consolidation occurring above it
Bottom: Daily candle chart of NGS
-Stock finding support at bottom of wedge and 200 day EMA
-Local price support found at upturning 5 day EMA
My expectation is the next move higher will break out of the wedge and give rise to a larger rally given the context of the weekly candle chart breakout, hence the 'breakout within breakout'
*Although I am showing a WEEKLY timeframe on the top chart, I am indeed showing the 200 DAY EMA on BOTH charts
Disclaimer
The information and publications are not meant to be, and do not constitute, financial, investment, trading, or other types of advice or recommendations supplied or endorsed by TradingView. Read more in the Terms of Use.
Disclaimer
The information and publications are not meant to be, and do not constitute, financial, investment, trading, or other types of advice or recommendations supplied or endorsed by TradingView. Read more in the Terms of Use.