#NIBI
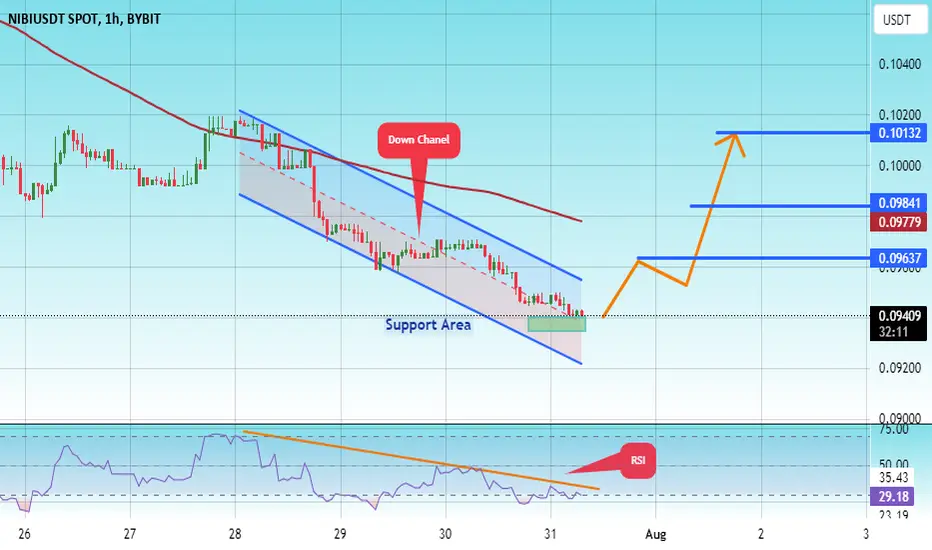
The price is moving within a descending channel pattern on the 1-hour frame and broke it upwards after adhering to it significantly
We have a downtrend on the RSI indicator and it was broken upwards and we have a trend to stabilize above it
We have a major support level in green at a price of 0.09300
We have a trend to dot above the moving average 100
Entry price 0.09400
First target 0.09630
Second target 0.09840
Third target 0.1013
🚨 For More Signals Join Telegram Channel ( Futures/Spot )
👉 t.me/CryptoSignalFuturesSpot
👉 t.me/CryptoSignalFuturesSpot
Disclaimer
The information and publications are not meant to be, and do not constitute, financial, investment, trading, or other types of advice or recommendations supplied or endorsed by TradingView. Read more in the Terms of Use.