Assending Triangle Chart pattern in Nifty- Breakout Possible ?
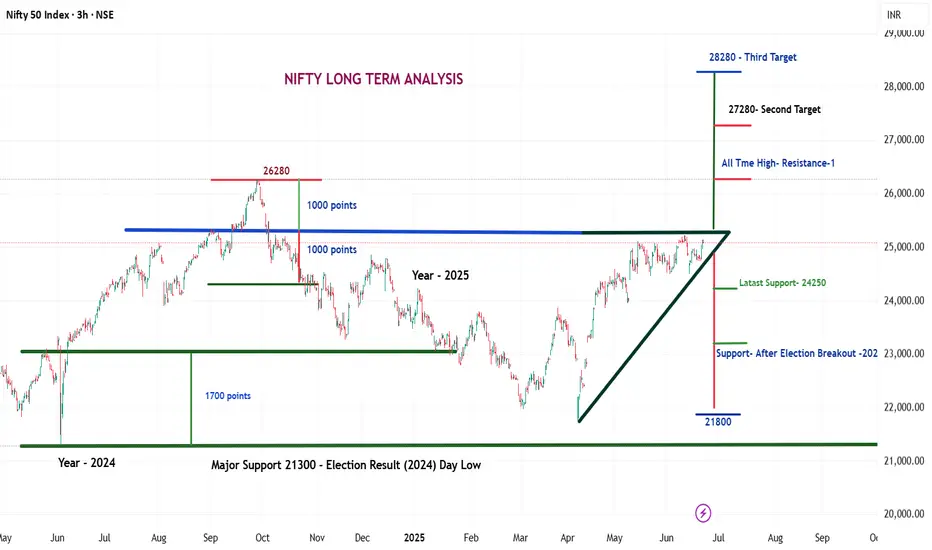
As of June 21, 2025, the Nifty 50 index is showing a strong and potentially decisive Ascending Triangle Pattern on the 3-hour time frame.
This formation typically indicates a bullish breakout if confirmed with volume. Let’s dive deep into the technical outlook and key levels that traders and investors should watch.
Current Market Overview
Current Nifty Level: ~25,080
Pattern Identified: Ascending Triangle
Time Frame: 3H (Medium-Term to Long-Term Insight)
An Ascending Triangle is a bullish continuation pattern formed by a horizontal resistance line and a rising trendline of higher lows.
Key Levels to Watch
Resistance Zone:
Immediate Resistance: 26,280 (All-Time High)
Breakout Target 2: 27,280
Breakout Target 3: 28000 (Long-Term)
If Nifty breaks above the 26,280 level with strong volume confirmation, the next upward targets will be 27,280 and possibly 28000 , based on the measured move from the triangle height.
Support Levels:
If any major negative trigger (geopolitical or macroeconomic) occurs, a sharp correction can’t be ruled out. The levels mentioned will act as key demand zones.
Potential Global Risks
While the technical setup is bullish, external risks could spoil the party:
Geopolitical Conflicts:
Iran vs. Israel
India vs. Pakistan
China vs. US tensions
Macro-Economic Triggers:
Spike in Inflation or Crude Oil Prices
US Fed Rate Hike Surprises
Global Recession Fears
In such cases, a steep fall toward 22,800 or even 21,300 may occur.
✅ Conclusion & Strategy
The current Nifty setup presents a classic high-reward-low-risk opportunity for long-term traders if a breakout is confirmed. However, caution is advised if global uncertainties increase. Investors should:
How Traders Can Prepare for the Next Move
Whether a breakout or breakdown happens, traders must:
Use proper stop-loss and risk management
Wait for volume confirmation
Watch for FII/DII activity
Combine price action with Data Analysis
Important Note:
This analysis is based on current chart patterns and known global events. Always use proper risk management and consult with a financial advisor before taking investment decisions.
💬 Like the chart if you found it useful
🗣 Comment your views or questions
👤 Follow us for regular breakout updates
🔁 Share this chart with your trading community and friends who follow Nifty!
✅ Let’s grow together with smart chart analysis and technical strategies.
Disclaimer
The information and publications are not meant to be, and do not constitute, financial, investment, trading, or other types of advice or recommendations supplied or endorsed by TradingView. Read more in the Terms of Use.
Disclaimer
The information and publications are not meant to be, and do not constitute, financial, investment, trading, or other types of advice or recommendations supplied or endorsed by TradingView. Read more in the Terms of Use.