🟢 Nifty Analysis EOD – June 10, 2025 – Monday 🔴
🔄 Fallback From the Top – Another Rangebound Day
Nifty began the session on a bullish note with a Gap-Up of 97 points at 25,199.30, but that turned out to be both the Open and High of the day.
Within the first 20 minutes, the index plunged 144 points, even breaking below the previous day’s low, signaling a swift sentiment shift. However, just a few minutes later, it rebounded sharply and tested the previous day’s high — not surprising, given the narrow range of the prior session.
But after 11:00 AM, the action dried up. The rest of the day saw tight, sideways movement within just 35 points, eventually closing at 25,104.25, barely 1 point above the previous close.
On paper, it looks like a neutral session, but price action reveals weakness and distribution near the top. Bulls need to reclaim control quickly, or the door opens for a short-term dip.
🛡 5 Min Chart with Levels

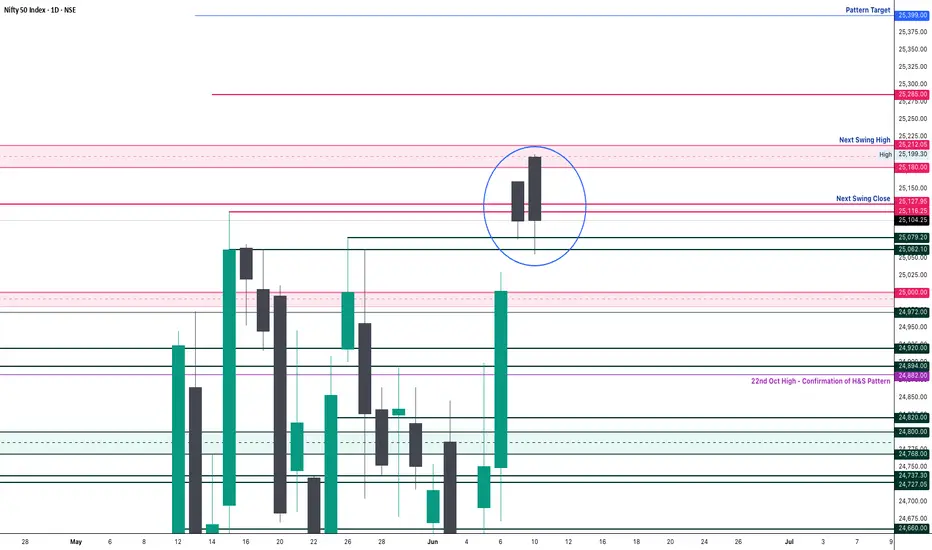
🕯 Daily Time Frame Chart

🕯 Daily Candle Breakdown
Open: 25,196.05
High: 25,199.30
Low: 25,055.45
Close: 25,104.25
Net Change: +1.05 (0.00%)
📊 Candle Structure Breakdown
Real Body: 91.80 pts → 🔴 Red Candle (Close < Open)
Upper Wick: 3.25 pts (Very Small)
Lower Wick: 48.80 pts
🔍 Interpretation
Price opened at the top, immediately reversed, and closed near the lower end of the day’s range.
Despite the flat close, the intraday structure is weak, showing signs of profit booking or early distribution.
The small upper wick reflects no follow-through buying.
🔦 Candle Type
🟥 Bearish Candle with Long Body and Lower Wick– Often seen during pullbacks or trend pauses.
📌 Key Insight
Support near 25,050–25,070 is critical—if it breaks, expect further downside pressure.
Bulls must reclaim 25,200 to keep the uptrend intact.
🛡 5 Min Intraday Chart

⚔️ Gladiator Strategy Update
ATR: 250.71
IB Range: 143.85 → Medium IB
Market Structure: Balanced
Trades:❌ No Trade Triggered by the system
📌 Support & Resistance Zones
Resistance Levels
25,116 ~ 25,128
25,180 ~ 25,212
25,285
Support Levels
25,062 ~ 25,070
24,972
24,920 ~ 24,894
24,800 ~ 24,768
💭 Final Thoughts
Market is playing inside a box, testing patience on both sides.Expansion is near, but which way? Keep risk defined and emotions in check.
🧠 “Don't mistake silence for weakness. The market is coiling—ready to snap.”
✏️ Disclaimer
This is just my personal viewpoint. Always consult your financial advisor before taking any action.
🔄 Fallback From the Top – Another Rangebound Day
Nifty began the session on a bullish note with a Gap-Up of 97 points at 25,199.30, but that turned out to be both the Open and High of the day.
Within the first 20 minutes, the index plunged 144 points, even breaking below the previous day’s low, signaling a swift sentiment shift. However, just a few minutes later, it rebounded sharply and tested the previous day’s high — not surprising, given the narrow range of the prior session.
But after 11:00 AM, the action dried up. The rest of the day saw tight, sideways movement within just 35 points, eventually closing at 25,104.25, barely 1 point above the previous close.
On paper, it looks like a neutral session, but price action reveals weakness and distribution near the top. Bulls need to reclaim control quickly, or the door opens for a short-term dip.
🛡 5 Min Chart with Levels
🕯 Daily Time Frame Chart
🕯 Daily Candle Breakdown
Open: 25,196.05
High: 25,199.30
Low: 25,055.45
Close: 25,104.25
Net Change: +1.05 (0.00%)
📊 Candle Structure Breakdown
Real Body: 91.80 pts → 🔴 Red Candle (Close < Open)
Upper Wick: 3.25 pts (Very Small)
Lower Wick: 48.80 pts
🔍 Interpretation
Price opened at the top, immediately reversed, and closed near the lower end of the day’s range.
Despite the flat close, the intraday structure is weak, showing signs of profit booking or early distribution.
The small upper wick reflects no follow-through buying.
🔦 Candle Type
🟥 Bearish Candle with Long Body and Lower Wick– Often seen during pullbacks or trend pauses.
📌 Key Insight
Support near 25,050–25,070 is critical—if it breaks, expect further downside pressure.
Bulls must reclaim 25,200 to keep the uptrend intact.
🛡 5 Min Intraday Chart
⚔️ Gladiator Strategy Update
ATR: 250.71
IB Range: 143.85 → Medium IB
Market Structure: Balanced
Trades:❌ No Trade Triggered by the system
📌 Support & Resistance Zones
Resistance Levels
25,116 ~ 25,128
25,180 ~ 25,212
25,285
Support Levels
25,062 ~ 25,070
24,972
24,920 ~ 24,894
24,800 ~ 24,768
💭 Final Thoughts
Market is playing inside a box, testing patience on both sides.Expansion is near, but which way? Keep risk defined and emotions in check.
🧠 “Don't mistake silence for weakness. The market is coiling—ready to snap.”
✏️ Disclaimer
This is just my personal viewpoint. Always consult your financial advisor before taking any action.
Read my blogs here:
substack.com/@kzatakia
Follow me on Telegram:
t.me/swingtraderhub
Follow me on X:
x.com/kzatakia
substack.com/@kzatakia
Follow me on Telegram:
t.me/swingtraderhub
Follow me on X:
x.com/kzatakia
Related publications
Disclaimer
The information and publications are not meant to be, and do not constitute, financial, investment, trading, or other types of advice or recommendations supplied or endorsed by TradingView. Read more in the Terms of Use.