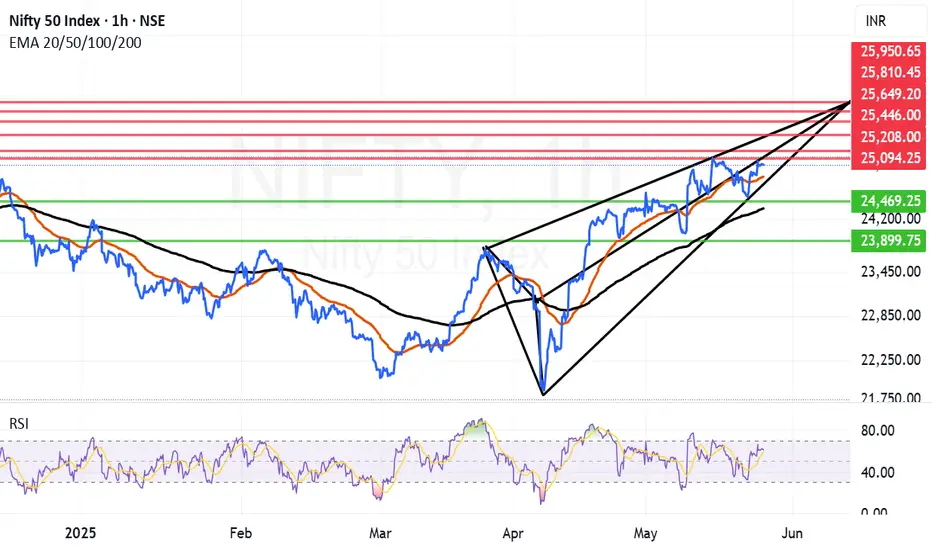
Nifty is trying to move upwards after taking Mother line support. However there are strong resistances which Nifty needs to conquer in order to move ahead substantially. These resistances are near 25094 and 25208.
Closing above 25208 will confirm the current trend which can tae Nifty close to 26K with other resistances at 25446, 25649 and 25810. Supports for Nifty currently are near 24820 (Mother line support), 24469, 24356 (Father line support) and 23899.
The direction of arrow is clear for medium term unless the arrow is broken on the down side. Nifty is currently forming a positive higher highs, higher lows pattern which is again a positive sign.
Disclaimer: The above information is provided for educational purpose, analysis and paper trading only. Please don't treat this as a buy or sell recommendation for the stock or index. The Techno-Funda analysis is based on data that is more than 3 months old. Supports and Resistances are determined by historic past peaks and Valley in the chart. Many other indicators and patterns like EMA, RSI, MACD, Volumes, Fibonacci, parallel channel etc. use historic data which is 3 months or older cyclical points. There is no guarantee they will work in future as markets are highly volatile and swings in prices are also due to macro and micro factors based on actions taken by the company as well as region and global events. Equity investment is subject to risks. I or my clients or family members might have positions in the stocks that we mention in our educational posts. We will not be responsible for any Profit or loss that may occur due to any financial decision taken based on any data provided in this message. Do consult your investment advisor before taking any financial decisions. Stop losses should be an important part of any investment in equity.
Disclaimer
The information and publications are not meant to be, and do not constitute, financial, investment, trading, or other types of advice or recommendations supplied or endorsed by TradingView. Read more in the Terms of Use.
Disclaimer
The information and publications are not meant to be, and do not constitute, financial, investment, trading, or other types of advice or recommendations supplied or endorsed by TradingView. Read more in the Terms of Use.