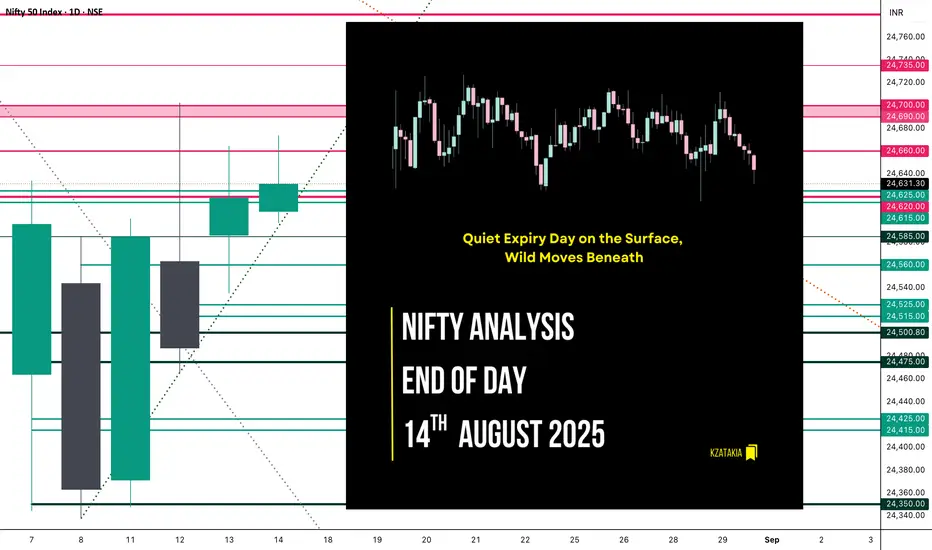
🟢 Nifty Analysis EOD – August 14, 2025 – Thursday 🔴
Quiet Expiry Day on the Surface, Wild Moves Beneath
🗞 Nifty Summary
Nifty opened neutral, and within the first 1 minute carved a 60-point range — a range that turned out to be almost the entire day’s action. For the rest of the session, the index stayed locked inside this band, repeatedly attempting to break above the PDH + R1 zone, but each time failing to sustain. Similarly, the lower boundary provided reliable support, keeping Nifty trapped.
While the overall weekly expiry felt silent in terms of range, the price action inside the band was anything but quiet — wild intraday swings offered ample opportunities for scalpers and quick traders. Structurally, today’s range stayed inside the previous day’s range, aside from a few points of false breakout shadows.
The game plan for the next session remains the same as discussed yesterday — we’re still waiting for a decisive breakout from this coiling structure.
Refere the game plan here:
🛡 5 Min Intraday Chart with Levels

📉 Daily Time Frame Chart with Intraday Levels

🕯 Daily Candle Breakdown
Candle Data:
Structure Breakdown:
Green candle (Close > Open)
Body size: 24.05 points → very small → low momentum
Upper wick: 42.35 points
Lower wick: 10.35 points
Interpretation:
Market opened near yesterday’s close, tried pushing higher but failed to hold gains.
Small green body signals sideways indecision; buyers still defended the 24,600 zone.
Longer upper wick vs lower wick → selling pressure near highs.
Candle Type:
Small-bodied Spinning Top / Doji-like candle → indecision, no clear trend control.
📊 Short-Term View
Consolidation persists in 24,600–24,650 zone.
Break above 24,675 = bullish strength.
Break below 24,595 = bearish momentum toward 24,535–24,460.
Range & Bias:
Support: 24,595 – 24,535
Resistance: 24,675 – 24,700
Bias: Neutral-to-mildly bullish above 24,600
🛡 5 Min Intraday Chart

⚔ Gladiator Strategy Update
ATR: 199.36
IB Range: 68.25 → Medium
Market Structure: Balanced
Trade Highlight: No Trade Triggered
📌 Support & Resistance Levels
Resistance Zones:
Support Zones:
💡 Final Thoughts
"The tighter the coil, the sharper the breakout."
Nifty is compressing hard — a breakout is inevitable, and expiry’s quietness might just be the calm before a directional move.
✏️ Disclaimer
This is a personal market observation, not financial advice.
Quiet Expiry Day on the Surface, Wild Moves Beneath
🗞 Nifty Summary
Nifty opened neutral, and within the first 1 minute carved a 60-point range — a range that turned out to be almost the entire day’s action. For the rest of the session, the index stayed locked inside this band, repeatedly attempting to break above the PDH + R1 zone, but each time failing to sustain. Similarly, the lower boundary provided reliable support, keeping Nifty trapped.
While the overall weekly expiry felt silent in terms of range, the price action inside the band was anything but quiet — wild intraday swings offered ample opportunities for scalpers and quick traders. Structurally, today’s range stayed inside the previous day’s range, aside from a few points of false breakout shadows.
The game plan for the next session remains the same as discussed yesterday — we’re still waiting for a decisive breakout from this coiling structure.
Refere the game plan here:
🛡 5 Min Intraday Chart with Levels
📉 Daily Time Frame Chart with Intraday Levels
🕯 Daily Candle Breakdown
Candle Data:
- Open: 24,607.25
- High: 24,673.65
- Low: 24,596.90
- Close: 24,631.30
- Change: +11.95 (+0.05%)
Structure Breakdown:
Green candle (Close > Open)
Body size: 24.05 points → very small → low momentum
Upper wick: 42.35 points
Lower wick: 10.35 points
Interpretation:
Market opened near yesterday’s close, tried pushing higher but failed to hold gains.
Small green body signals sideways indecision; buyers still defended the 24,600 zone.
Longer upper wick vs lower wick → selling pressure near highs.
Candle Type:
Small-bodied Spinning Top / Doji-like candle → indecision, no clear trend control.
📊 Short-Term View
Consolidation persists in 24,600–24,650 zone.
Break above 24,675 = bullish strength.
Break below 24,595 = bearish momentum toward 24,535–24,460.
Range & Bias:
Support: 24,595 – 24,535
Resistance: 24,675 – 24,700
Bias: Neutral-to-mildly bullish above 24,600
🛡 5 Min Intraday Chart
⚔ Gladiator Strategy Update
ATR: 199.36
IB Range: 68.25 → Medium
Market Structure: Balanced
Trade Highlight: No Trade Triggered
📌 Support & Resistance Levels
Resistance Zones:
- 24,660
- 24,690 ~ 24,700
- 24,735
- 24,780
Support Zones:
- 24,585
- 24,560
- 24,525 ~ 24,515
- 24,500
- 24,475
💡 Final Thoughts
"The tighter the coil, the sharper the breakout."
Nifty is compressing hard — a breakout is inevitable, and expiry’s quietness might just be the calm before a directional move.
✏️ Disclaimer
This is a personal market observation, not financial advice.
Read my blogs here:
substack.com/@kzatakia
Follow me on Telegram:
t.me/swingtraderhub
Follow me on X:
x.com/kzatakia
substack.com/@kzatakia
Follow me on Telegram:
t.me/swingtraderhub
Follow me on X:
x.com/kzatakia
Related publications
Disclaimer
The information and publications are not meant to be, and do not constitute, financial, investment, trading, or other types of advice or recommendations supplied or endorsed by TradingView. Read more in the Terms of Use.