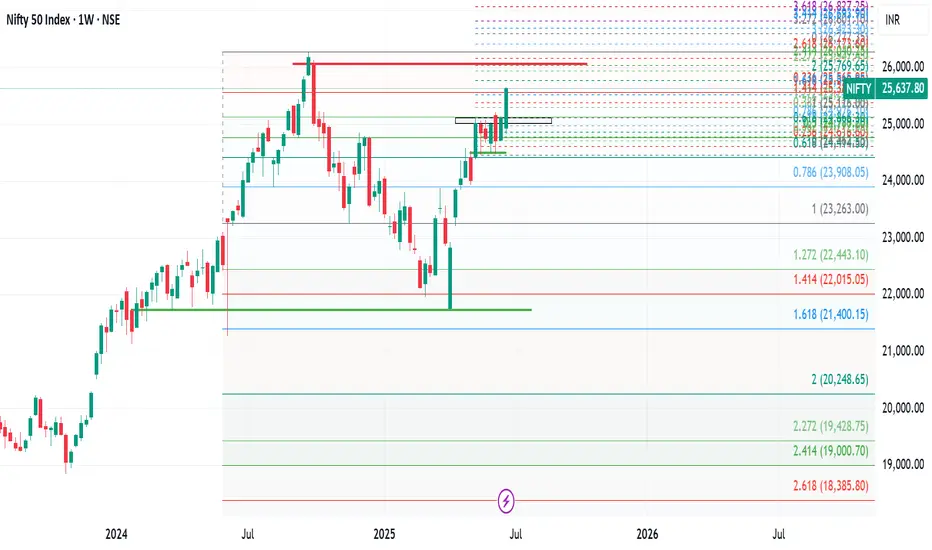
The Indian stock market saw a strong bullish move this week, with Nifty 50 closing at 25,637, marking a significant gain of 525 points from the previous week's close. The index made a high of 25,654 and a low of 24,824, finally breaking out of the key resistance zone of 25,000–25,100 after five weeks of sideways consolidation.
This breakout is a critical technical development, signaling renewed strength in the broader market. However, to sustain this momentum and target the all-time high zone of 26,134–26,277, Nifty may need to either:
Consolidate within the previous week's range of 25,650–24,800, or
Retest the breakout level near 25,200 for confirmation.
Failing to do so could make this breakout a false one.
Weekly Outlook for Nifty:
For the coming week, the expected trading range is between 25,200 and 26,150. Price action around these levels will be key to watch.
On a broader sectoral view, out of 14 NSE indices, only Nifty Financial Services is showing relative strength on the monthly chart—a potential red flag for sustained bullish sentiment. When just one sector leads while others lag, it's often a sign to remain cautious.
Strategy Suggestion:
Consider booking partial profits and trailing stop losses on the remaining positions. Until the monthly time frame turns decisively bullish, it's wise to stay alert and manage risk actively.
Global Markets: S&P 500 Breaks Out!
In the U.S., the S&P 500 surged to close at 6,173, successfully breaking above its key resistance level at 6,013. This breakout, if sustained above 6,150 next week, opens up the path toward higher targets: 6,225 / 6,376 / 6,454 / 6,500.
However, traders should remain flexible. If the breakout fails, we could see a pullback to support zones near 6,013 or even 5,899.
Pro Tip:
Be ready to switch trading positions quickly if the breakout doesn’t hold—volatility is still very much in play in both Indian and U.S. markets.
Disclaimer
The information and publications are not meant to be, and do not constitute, financial, investment, trading, or other types of advice or recommendations supplied or endorsed by TradingView. Read more in the Terms of Use.
Disclaimer
The information and publications are not meant to be, and do not constitute, financial, investment, trading, or other types of advice or recommendations supplied or endorsed by TradingView. Read more in the Terms of Use.