Pattern Type:
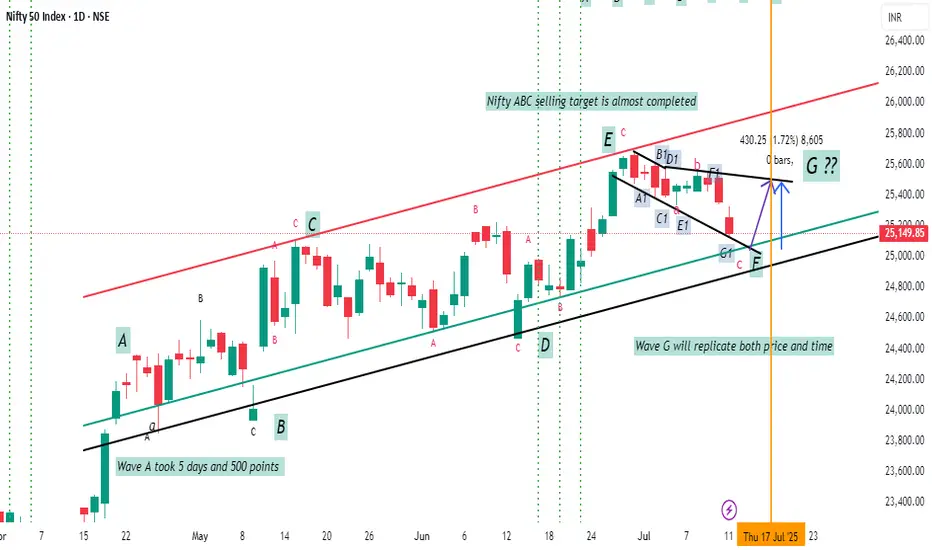
The structure is a Diametric pattern (7 legs) labeled A-B-C-D-E-F-G, currently expecting Wave G to unfold.
✅ Wave Details Noted on Chart:
Wave A: Took 5 days and moved ~500 points.
Wave B to E: Forming the characteristic bow-tie shape of a Diametric.
Wave F: Seems to have just completed or is near completion.
Wave G (Forecasted): Expected to mirror Wave A in both price and time (5 days / 500 points), suggesting a potential upward move from current levels.
🧭 Trendline Insights:
A red resistance trendline connects tops (Wave C to Wave E).
A black support trendline spans from the origin to Wave D and likely acts as support for Wave F.
Price is currently near the lower boundary, hinting at a possible reversal point.
💬 Annotations Highlight:
"Nifty ABC: selling target is almost completed" → suggests bearish move has played out.
"Wave G will replicate both price and time" → implies a measured bullish move is anticipated.
The substructure inside E-F is detailed as A1-B1-C1-D1-E1-F1-G1, possibly hinting at an internal smaller diametric or triangle.
🔮 Projection:
A bullish reversal (Wave G) is expected next.
Potential upside: ~500 points over 5 days (same as Wave A).
Support at the trendline and structure suggests this is a critical zone for bounce.
✅ Summary in One Line:
Nifty appears to be completing a Diametric (7-leg) corrective pattern, with Wave G projected next — likely an upward move matching Wave A’s time and magnitude (~500 pts / 5 days), assuming Wave F is now done.
Technical Analyst BY Passion
Disclaimer
The information and publications are not meant to be, and do not constitute, financial, investment, trading, or other types of advice or recommendations supplied or endorsed by TradingView. Read more in the Terms of Use.
Technical Analyst BY Passion
Disclaimer
The information and publications are not meant to be, and do not constitute, financial, investment, trading, or other types of advice or recommendations supplied or endorsed by TradingView. Read more in the Terms of Use.